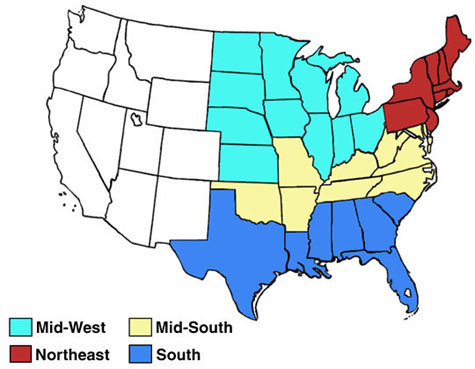
 Figure 1. U.S. Map Showing Four Regions
Introduction
An abundance of information and resources are available through the Dairy Records Management Systems (DRMS), Raleigh, NC for use in herd management analysis. The DHI-202 Herd Summary Report is a valuable source of information. Many herd management strengths and weaknesses can be uncovered using herd summary data.
The purpose of this bulletin is to provide production and management benchmarks for Holstein herds processed by DRMS. Some examples of using and applying benchmark values are provided. However, this bulletin should be viewed primarily as a comprehensive resource of production and management benchmark values. These benchmarks will be useful to dairy producers, dairy managers, consultants, veterinarians and agribusiness representatives as a first step in the analysis of herd management practices.
Methods
Herd Summary information was obtained from the DRMS, Raleigh, North Carolina, for Holstein herds last tested in November or December, 2000. Data analysis was performed using the Statistical Analysis System (SAS) (1). Research has shown that management variables may differ by region of the country, herd size and milk production level. Consequently, benchmark values are presented for Northeast, Mid-South, Midwest and South regions (Figure 1). Within regions, values are further subdivided by either herd size or rolling herd average milk production. Values in all tables and graphs were limited to herds with a minimum of 25 cows and a rolling herd average of 12,000 pounds or more. All analyses and calculations are based on herd average information and not individual cow data.
The number of observations, mean, standard deviation and percentile ranks were calculated for certain benchmarks values. Following are definitions of these terms:
N: The number of observations (herds) included in a specific analysis. Each variable was analyzed separately so N differs depending upon the number of herds having a specific variable.
Mean: The average calculated as the sum of all observations divided by N.
Standard Deviation (SD): A measure of the variability of the observations. The larger the SD the greater the variation is among the observations.
Percentile Rank: Percentiles are defined as a value such that X% fall short of the value and Y% exceed the value. For example, if a bench-mark value is at the 75th percentile, then 75% of the herds analyzed had values below and 25% of the herds had values above the benchmark. A herd value at the 75th percentile rank is in the top 25% of all herds analyzed.
Rolling Herd Average Production
The Dairy Herd Improvement (DHI) rolling herd average (RHA) is the logical first management item to consider when beginning a herd analysis. The RHA measures the annual overall performance and efficiency of all cows in a herd. High producing cows generally are more efficient than lower producing cows. Factories that produce at full capacity are usually more efficient, since fixed costs (buildings, machinery) are spread out over more units of production. Likewise, high producing cows tend to be the most efficient since fixed costs (body maintenance requirements, taxes, insurance) are spread out over more pounds of milk, which reduces the overall cost per pound.
RHA is not a direct measure of profitability. It does not provide information related to operating costs, debt load or the cost of producing a hundred pounds of milk. The RHA does not reveal anything about a farm’s cash flow position. A farm with a high RHA could have a reduced cash flow just because the current month’s production is down.
It is possible for dairy producers with high RHAs to go broke. Debt level and/or operating costs may be so high that no level of production can support the farm. Other producers can live comfortably on aver-age or below average RHAs. These herd owners may not be as efficient as they could be but are probably as efficient as they want to be. Some producers may be willing to sacrifice some production (RHA) be-cause low cost inputs are available such as relatively inexpensive feedstuff. These situations may be profitable but analyze them carefully by partial budgeting to determine if the decreased costs will more than offset the lost income from lower production. Such decisions should be based on facts and not hunches.
The RHA doesn’t provide everything we want to know about a farm’s performance. A high RHA should not be a goal in and of itself for most dairy producers. However, improving a RHA by applying management practices that have been shown to be cost effective is a worthwhile goal for any producer. The RHA should not be used to evaluate current management practices. Rather the RHA is an indicator of herd management during the last 365 days and can be used to evaluate changes in management practices over time.
Many factors including calving interval, mastitis, feed quality, days dry, culling rate, herd health and heifer raising practices directly or indirectly affect the RHA. The RHA is only one factor to consider when evaluating a herd. Accurate evaluation of the total performance of a herd requires more information than just the RHA. If the RHA increases or decreases significantly, one should ask why the change occurred and pinpoint the cause.
Tables 1-4 show the rolling herd average milk, fat, protein, fat percent and protein percent by region and by herd size groups within region. For example, Joe Dairyman has a herd of 110 Holstein cows in South Carolina with a rolling herd average for milk of 20,501 pounds. He refers to the 100-149 size cow group in Table 4. The mean or average milk production for 155 herds was 17,665 pounds. Production for his herd is above the 75th percentile rank of 20,481 pounds. This places Joe Dairyman’s herd with a RHA of 20,501 pounds in the top 25 percent of the 155 herds analyzed.
Trends in Monthly Milk Production
Several terms express how much milk is produced or is expected to be produced by an individual or group of dairy cows. The Test Day Average (milking cows) shows the current production situation in a dairy herd. This figure is calculated by dividing the sum of all the test day milk weights by the total number of milking cows with milk weights on test day.
The dollar value of Test Day Average Production (milking cows) times the number of milking cows determines how much cash is available from the sale of milk. This “average” is what pays the bills, feeds the family and services debt. Many management factors such as changes in feeding or forage quality can affect this average. Other less direct factors such as changes in the weather, genetics and stage of lactation can also affect the Test Day Average. Stage of lactation or average days in milk for the herd influences the Test Day Average since peak production occurs early in lactation and steadily declines to the dry off date. Consequently, test day production catches each cow at a different stage of lactation.
In order to remove the effect of average days in milk upon test day production, another measure of daily performance has been developed called “Standardized 150 Day Milk.” This number estimates what an average cow in the herd would be producing if she were at day 150 of her lactation. Cows in early lactation are projected ahead to day 150; whereas cows in later lactation are adjusted to day 150. This provides the means to compare average production at different times of the year without the influence of days in milk.
Figures 2-4 show the monthly trend for days in milk, test day milk and standardized 150 day milk by region. Note the significant drop in test day milk production during the summer months especially in the South region and to a lesser extent in the Mid-South. One factor that contributes to the decline in summer production is a corresponding rise in days in milk during the same months. The decline in production during the summer has a significant affect on a dairy’s cash flow. The standardized 150 day milk value also declines during the summer but to a lesser degree since the effect of days in milk has been removed. Many other factors may cause 150 day milk to change such as feeding, nutrition, mastitis and heat stress. Much of the drop in standardized milk during the summer months is undoubtedly related to heat stress. Average daily milk, standardized milk and days in milk curves for individual herds would be expected to differ from these standard curves. However, the standard curves can be used to compare and evaluate individual herd curves.
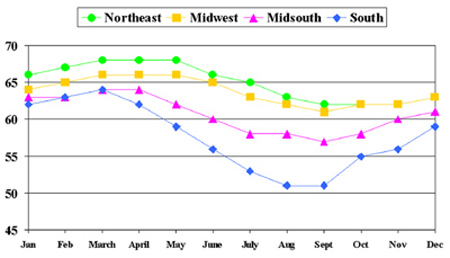 Figure 2. Average Test Day Milk by Month by Region.
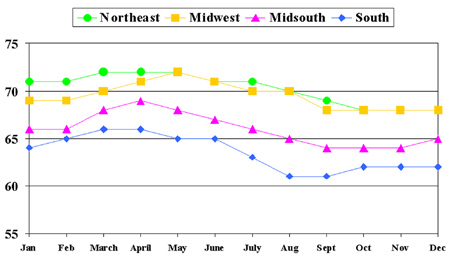 Figure 3. Average Standardized Milk by Month by Region.
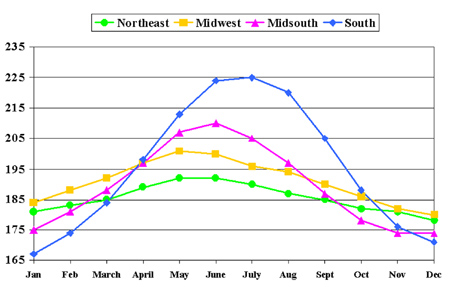 Figure 4. Average Days in Milk by Month by Region.
Monitoring Stage of Lactation Production
Lactation milk production is dependent upon the level of peak or summit production and the level of persistency throughout the remainder of the lactation. Since lactation curves vary depending upon age, an examination of the stage of lactation production by lactation group is recommended. Tables 5-8 show milk production by stage of lactation for three lactation groups (1, 2 and 3+) by herd milk production level in four regions. Joe Dairyman in South Carolina with a herd average of 19,745 pounds wants to know the expected production of second lactation cows at days 1-40 in milk. He refers to Table 8 for the south region. Under second lactation cows days 1-40 in milk, he finds 78 pounds of milk as the average production for cows in herds with a rolling herd average of 19,000-19,999 pounds.
Tables 9-12 provide fat and protein percentages by stage of lactation in the same format as indicated for milk production. Values in these tables are averages for all lactation groups only.
When evaluating a herd for milk or component levels by stage of lactation, particular attention should be given to the number of milking cows represented at each stage of lactation for the herd being evaluated. If only a few cows (fewer than 5), contributed to the average, the probability of an accurate comparison is reduced.
Summit Milk Production
Summit milk is the average of the two highest of the first three test days milk production. Summit milk is highly correlated with the rolling herd average. An increase of 1 pound summit milk production will usually result in an increase of about 225 pounds milk for the lactation. Summit milk production by region and herd milk production is in Table 13. The average summit milk production for a herd should be evaluated for each lactation group. Then evaluate how well one lactation group is performing compared to another using the ratios in Table 13. A larger than expected deviation in summit yields among cows of different age groups may indicate that management conditions vary among the groups.
For example, Gil Cowman in Florida with a rolling herd average of 19,542 pounds has summit milk production of 63 pounds and 83 pounds for his first and second lactation cows respectively. The expected values for a 19,000-pound herd average in Table 13 for the South region is 65 pounds and 81 pounds. The ratio of first lactation cows compared to second lactation cows (1:2) is 80. This means that for this herd average and region, first lactation cows produce summit milk levels of about 80 percent of second lactation cows. The ratio of Joe’s cows is 63/83 or 76. The summit yield for his first lactation cows is lower than expected compared to other herds (63 pounds vs. 65 pounds). Also, the average summit production of his first lactation cows is lower than expected compared to his second lactation cows (76% actual vs. 80% expected).
Other Management Factors
Reasons Cows Leave the Herd
The percentage of cows entering and leaving the herd (turnover) can significantly affect the rolling herd average and should receive consideration during a herd production evaluation. Tables 14-17 show the percent cows entering and leaving the herd by region and herd milk production level. Also included are the percent cows leaving the herd for specific reasons. These values are calculated as the number of cows leaving for a specific reason ÷ the total cows leaving the herd x 100. Since only numbers of cows are listed on the producer’s DHI-202 for reasons leaving the herd, this calculation to percentages is required to make a comparison with the values in the reference tables.
Average Age and Distribution of Herd by Age
The average age of a herd and the distribution of cows within age groups are factors that affect herd production. Table 18 shows the average age of cows within three lactation groups and the percent distributed by region and herd average production.
The optimum age of a herd and the distribution of cows by lactation group is probably unique for each herd since many factors affect herd age. The percentage of cows entering and leaving the herd is a major factor affecting herd age. Other management practices including culling strategies and the availability of replacements are also important.
Summary
Comparison of herd performance with benchmark values is the first step in the analysis of herd management production practices. After identifying management weaknesses, attention should focus on the causes of suboptimal performance. Correcting management deficiencies requires the setting of goals and monitoring progress toward achieving those goals.
References
SAS/STAT® User’s Guide: Statistics, Version 6.12. 1996. SAS Inst., Inc., Cary, NC.
DHI-202 Herd Summary Fact Sheet: A-1. 1997. Dairy Records Management Systems, Raleigh, NC.
Table 1. Rolling Herd Average Production in the Northeast Region by Herd Size
Up to 50 cows
| Production | Percentile Rank | |||||||
|---|---|---|---|---|---|---|---|---|
| Product | N | Mean | SD | 10th | 25th | 50th | 75th | 90th |
| Milk (lbs) | 1428 | 20091 | 2852 | 16500 | 18232 | 20181 | 21896 | 23471 |
| Fat (lbs) | 1420 | 754 | 103 | 616 | 680 | 746 | 809 | 870 |
| Protein (lbs) | 1420 | 612 | 88 | 498 | 555 | 615 | 666 | 719 |
| Fat (%) | 1421 | 3.7 | 0.2 | 3.5 | 3.6 | 3.7 | 3.8 | 4.0 |
| Protein (%) | 1421 | 3.0 | 0.1 | 2.9 | 3.0 | 3.0 | 3.1 | 3.1 |
50 to 99 cows
| Production | Percentile Rank | |||||||
|---|---|---|---|---|---|---|---|---|
| Product | N | Mean | SD | 10th | 25th | 50th | 75th | 90th |
| Milk (lbs) | 2000 | 20643 | 3093 | 16694 | 18569 | 20636 | 22582 | 24524 |
| Fat (lbs) | 1978 | 764 | 112 | 625 | 688 | 763 | 835 | 900 |
| Protein (lbs) | 1978 | 636 | 98 | 516 | 573 | 638 | 698 | 753 |
| Fat (%) | 1985 | 3.7 | 0.2 | 3.5 | 3.6 | 3.7 | 3.8 | 3.9 |
| Protein (%) | 1985 | 3.1 | 0.2 | 3.0 | 3.0 | 3.1 | 3.1 | 3.2 |
100 to 149 cows
| Production | Percentile Rank | |||||||
|---|---|---|---|---|---|---|---|---|
| Product | N | Mean | SD | 10th | 25th | 50th | 75th | 90th |
| Milk (lbs) | 570 | 20850 | 3004 | 16975 | 18876 | 20821 | 22804 | 24462 |
| Fat (lbs) | 557 | 777 | 114 | 633 | 708 | 782 | 847 | 912 |
| Protein (lbs) | 557 | 646 | 93 | 524 | 588 | 648 | 708 | 755 |
| Fat (%) | 559 | 3.7 | 0.3 | 3.5 | 3.6 | 3.7 | 3.8 | 4.0 |
| Protein (%) | 559 | 3.1 | 0.1 | 3.0 | 3.0 | 3.1 | 3.2 | 3.2 |
150 to 249 cows
| Production | Percentile Rank | |||||||
|---|---|---|---|---|---|---|---|---|
| Product | N | Mean | SD | 10th | 25th | 50th | 75th | 90th |
| Milk (lbs) | 341 | 21519 | 2879 | 18066 | 19338 | 21294 | 23469 | 25280 |
| Fat (lbs) | 329 | 800 | 102 | 666 | 721 | 802 | 875 | 930 |
| Protein (lbs) | 329 | 667 | 85 | 559 | 600 | 663 | 729 | 778 |
| Fat (%) | 331 | 3.7 | 0.2 | 3.4 | 3.6 | 3.7 | 3.8 | 3.9 |
| Protein (%) | 331 | 3.1 | 0.1 | 3.0 | 3.0 | 3.1 | 3.1 | 3.1 |
250 to 349 cows
| Production | Percentile Rank | |||||||
|---|---|---|---|---|---|---|---|---|
| Product | N | Mean | SD | 10th | 25th | 50th | 75th | 90th |
| Milk (lbs) | 129 | 22133 | 2774 | 18712 | 20092 | 22433 | 24226 | 25436 |
| Fat (lbs) | 121 | 818 | 107 | 686 | 746 | 817 | 888 | 961 |
| Protein (lbs) | 121 | 681 | 82 | 579 | 628 | 689 | 741 | 775 |
| Fat (%) | 127 | 3.7 | 0.3 | 3.4 | 3.5 | 3.7 | 3.8 | 4.0 |
| Protein (%) | 127 | 3.1 | 0.1 | 3.0 | 3.0 | 3.1 | 3.1 | 3.2 |
350+ cows
| Production | Percentile Rank | |||||||
|---|---|---|---|---|---|---|---|---|
| Product | N | Mean | SD | 10th | 25th | 50th | 75th | 90th |
| Milk (lbs) | 170 | 23122 | 2698 | 18954 | 21173 | 23487 | 25134 | 26120 |
| Fat (lbs) | 164 | 836 | 101 | 699 | 752 | 849 | 908 | 951 |
| Protein (lbs) | 164 | 701 | 81 | 577 | 643 | 715 | 762 | 797 |
| Fat (%) | 166 | 3.6 | 0.2 | 3.4 | 3.5 | 3.6 | 3.8 | 3.9 |
| Protein (%) | 166 | 3.1 | 0.1 | 2.9 | 3.0 | 3.0 | 3.1 | 3.1 |
Table 2. Rolling Herd Average Production in the Mid-South Region by Herd Size
Up to 50 cows
| Production | Percentile Rank | |||||||
|---|---|---|---|---|---|---|---|---|
| Product | N | Mean | SD | 10th | 25th | 50th | 75th | 90th |
| Milk (lbs) | 189 | 18119 | 2690 | 14615 | 16168 | 18019 | 19928 | 21495 |
| Fat (lbs) | 189 | 648 | 103 | 525 | 572 | 634 | 715 | 809 |
| Protein (lbs) | 189 | 570 | 84 | 463 | 511 | 566 | 627 | 682 |
| Fat (%) | 189 | 3.6 | 0.2 | 3.3 | 3.4 | 3.6 | 3.7 | 3.9 |
| Protein (%) | 189 | 3.1 | 0.1 | 3.0 | 3.1 | 3.1 | 3.2 | 3.2 |
50 to 99 cows
| Production | Percentile Rank | |||||||
|---|---|---|---|---|---|---|---|---|
| Product | N | Mean | SD | 10th | 25th | 50th | 75th | 90th |
| Milk (lbs) | 723 | 18901 | 3074 | 14659 | 16566 | 18985 | 21094 | 22559 |
| Fat (lbs) | 702 | 678 | 115 | 521 | 593 | 680 | 761 | 818 |
| Protein (lbs) | 700 | 591 | 93 | 464 | 518 | 594 | 656 | 702 |
| Fat (%) | 713 | 3.6 | 0.3 | 3.3 | 3.4 | 3.6 | 3.7 | 3.8 |
| Protein (%) | 711 | 3.1 | 0.1 | 3.0 | 3.0 | 3.1 | 3.2 | 3.3 |
100 to 149 cows
| Production | Percentile Rank | |||||||
|---|---|---|---|---|---|---|---|---|
| Product | N | Mean | SD | 10th | 25th | 50th | 75th | 90th |
| Milk (lbs) | 477 | 19276 | 2882 | 15489 | 17428 | 19284 | 21422 | 22929 |
| Fat (lbs) | 461 | 694 | 115 | 550 | 624 | 689 | 778 | 843 |
| Protein (lbs) | 459 | 603 | 89 | 481 | 543 | 602 | 662 | 715 |
| Fat (%) | 465 | 3.6 | 0.3 | 3.2 | 3.5 | 3.6 | 3.8 | 3.9 |
| Protein (%) | 462 | 3.1 | 0.1 | 3.0 | 3.0 | 3.1 | 3.2 | 3.2 |
150 to 249 cows
| Production | Percentile Rank | |||||||
|---|---|---|---|---|---|---|---|---|
| Product | N | Mean | SD | 10th | 25th | 50th | 75th | 90th |
| Milk (lbs) | 269 | 19583 | 3106 | 15705 | 17235 | 19514 | 21594 | 23547 |
| Fat (lbs) | 257 | 718 | 132 | 546 | 615 | 725 | 803 | 882 |
| Protein (lbs) | 257 | 615 | 95 | 495 | 540 | 622 | 678 | 734 |
| Fat (%) | 261 | 3.6 | 0.3 | 3.3 | 3.5 | 3.7 | 3.8 | 4.0 |
| Protein (%) | 261 | 3.1 | 0.1 | 3.0 | 3.0 | 3.1 | 3.2 | 3.2 |
250+ cows
| Production | Percentile Rank | |||||||
|---|---|---|---|---|---|---|---|---|
| Product | N | Mean | SD | 10th | 25th | 50th | 75th | 90th |
| Milk (lbs) | 118 | 20185 | 3185 | 15827 | 18000 | 20257 | 22010 | 24583 |
| Fat (lbs) | 111 | 746 | 122 | 577 | 656 | 740 | 822 | 927 |
| Protein (lbs) | 109 | 630 | 115 | 495 | 561 | 638 | 688 | 761 |
| Fat (%) | 114 | 3.7 | 0.3 | 3.4 | 3.5 | 3.7 | 3.8 | 3.9 |
| Protein (%) | 112 | 3.1 | 0.2 | 3.0 | 3.1 | 3.1 | 3.2 | 3.2 |
Table 3. Rolling Herd Average Production in the Midwest Region by Herd Size
Up to 50 cows
| Production | Percentile Rank | |||||||
|---|---|---|---|---|---|---|---|---|
| Product | N | Mean | SD | 10th | 25th | 50th | 75th | 90th |
| Milk (lbs) | 778 | 19479 | 3168 | 15456 | 17242 | 19336 | 21619 | 23452 |
| Fat (lbs) | 774 | 736 | 127 | 575 | 650 | 728 | 820 | 895 |
| Protein (lbs) | 774 | 607 | 100 | 482 | 538 | 605 | 671 | 733 |
| Fat (%) | 777 | 3.8 | 0.3 | 3.5 | 3.6 | 3.7 | 3.9 | 4.1 |
| Protein (%) | 776 | 3.1 | 0.1 | 3 | 3 | 3.1 | 3.2 | 3.2 |
50-99 cows
| Production | Percentile Rank | |||||||
|---|---|---|---|---|---|---|---|---|
| Product | N | Mean | SD | 10th | 25th | 50th | 75th | 90th |
| Milk (lbs) | 1720 | 19978 | 3131 | 16052 | 17843 | 19937 | 21979 | 23986 |
| Fat (lbs) | 1704 | 751 | 125 | 595 | 666 | 747 | 827 | 912 |
| Protein (lbs) | 1704 | 624 | 95 | 505 | 559 | 623 | 684 | 748 |
| Fat (%) | 1708 | 3.8 | 0.3 | 3.5 | 3.6 | 3.7 | 3.9 | 4.1 |
| Protein (%) | 1708 | 3.1 | 0.1 | 3 | 3.1 | 3.1 | 3.2 | 3.2 |
100-149 cows
| Production | Percentile Rank | |||||||
|---|---|---|---|---|---|---|---|---|
| Product | N | Mean | SD | 10th | 25th | 50th | 75th | 90th |
| Milk (lbs) | 663 | 20982 | 3130 | 16914 | 18763 | 20847 | 23014 | 24890 |
| Fat (lbs) | 646 | 790 | 133 | 626 | 695 | 782 | 869 | 958 |
| Protein (lbs) | 646 | 654 | 94 | 527 | 589 | 652 | 715 | 775 |
| Fat (%) | 651 | 3.8 | 0.3 | 3.5 | 3.6 | 3.7 | 3.9 | 4.1 |
| Protein (%) | 651 | 3.1 | 0.1 | 3 | 3 | 3.1 | 3.2 | 3.2 |
150-249 cows
| Production | Percentile Rank | |||||||
|---|---|---|---|---|---|---|---|---|
| Product | N | Mean | SD | 10th | 25th | 50th | 75th | 90th |
| Milk (lbs) | 358 | 21377 | 3021 | 17511 | 19504 | 21104 | 23379 | 25330 |
| Fat (lbs) | 352 | 805 | 116 | 664 | 728 | 804 | 882 | 953 |
| Protein (lbs) | 352 | 666 | 87 | 551 | 612 | 664 | 727 | 779 |
| Fat (%) | 357 | 3.8 | 0.3 | 3.5 | 3.6 | 3.7 | 3.9 | 4.1 |
| Protein (%) | 357 | 3.1 | 0.1 | 3 | 3 | 3.1 | 3.2 | 3.2 |
250+ cows
| Production | Percentile Rank | |||||||
|---|---|---|---|---|---|---|---|---|
| Product | N | Mean | SD | 10th | 25th | 50th | 75th | 90th |
| Milk (lbs) | 222 | 22473 | 2811 | 18796 | 20607 | 22392 | 24457 | 25805 |
| Fat (lbs) | 212 | 828 | 115 | 703 | 754 | 822 | 892 | 968 |
| Protein (lbs) | 212 | 693 | 84 | 583 | 634 | 691 | 752 | 796 |
| Fat (%) | 218 | 3.7 | 0.3 | 3.4 | 3.5 | 3.7 | 3.8 | 4 |
| Protein (%) | 218 | 3.1 | 0.1 | 3 | 3 | 3.1 | 3.1 | 3.2 |
Table 4. Rolling Herd Average Production in the South Region by Herd Size
Up to 100 cows
| Production | Percentile Rank | |||||||
|---|---|---|---|---|---|---|---|---|
| Product | N | Mean | SD | 10th | 25th | 50th | 75th | 90th |
| Milk (lbs) | 136 | 17842 | 3027 | 13510 | 15599 | 17908 | 19775 | 21821 |
| Fat (lbs) | 111 | 619 | 114 | 455 | 544 | 622 | 701 | 763 |
| Protein (lbs) | 110 | 562 | 95 | 432 | 492 | 562 | 624 | 680 |
| Fat (%) | 117 | 3.4 | 0.3 | 3 | 3.3 | 3.5 | 3.6 | 3.9 |
| Protein (%) | 116 | 3.1 | 0.1 | 3 | 3 | 3.1 | 3.2 | 3.2 |
100 to 149 cows
| Production | Percentile Rank | |||||||
|---|---|---|---|---|---|---|---|---|
| Product | N | Mean | SD | 10th | 25th | 50th | 75th | 90th |
| Milk (lbs) | 155 | 17665 | 3254 | 13600 | 14822 | 17464 | 20481 | 22181 |
| Fat (lbs) | 119 | 642 | 135 | 462 | 525 | 649 | 743 | 820 |
| Protein (lbs) | 119 | 571 | 105 | 421 | 480 | 582 | 644 | 706 |
| Fat (%) | 127 | 3.5 | 0.3 | 3.2 | 3.4 | 3.6 | 3.7 | 3.8 |
| Protein (%) | 127 | 3.1 | 0.1 | 3 | 3.1 | 3.1 | 3.2 | 3.2 |
150 to 249 cows
| Production | Percentile Rank | |||||||
|---|---|---|---|---|---|---|---|---|
| Product | N | Mean | SD | 10th | 25th | 50th | 75th | 90th |
| Milk (lbs) | 195 | 18009 | 2905 | 14627 | 15676 | 17549 | 19977 | 22212 |
| Fat (lbs) | 132 | 664 | 130 | 506 | 567 | 654 | 753 | 826 |
| Protein (lbs) | 132 | 578 | 102 | 478 | 511 | 586 | 646 | 699 |
| Fat (%) | 145 | 3.6 | 0.3 | 3.3 | 3.4 | 3.6 | 3.7 | 3.9 |
| Protein (%) | 144 | 3.1 | 0.2 | 3 | 3.1 | 3.1 | 3.2 | 3.2 |
250 to 499 cows
| Production | Percentile Rank | |||||||
|---|---|---|---|---|---|---|---|---|
| Product | N | Mean | SD | 10th | 25th | 50th | 75th | 90th |
| Milk (lbs) | 144 | 18684 | 3109 | 15075 | 16234 | 18398 | 20757 | 22680 |
| Fat (lbs) | 90 | 724 | 126 | 562 | 644 | 712 | 818 | 889 |
| Protein (lbs) | 90 | 624 | 93 | 490 | 562 | 628 | 692 | 741 |
| Fat (%) | 96 | 3.6 | 0.3 | 3.3 | 3.5 | 3.6 | 3.8 | 3.9 |
| Protein (%) | 96 | 3.1 | 0.1 | 3 | 3.1 | 3.1 | 3.2 | 3.3 |
Herd Size 500+ cows
| Production | Percentile Rank | |||||||
|---|---|---|---|---|---|---|---|---|
| Product | N | Mean | SD | 10th | 25th | 50th | 75th | 90th |
| Milk (lbs) | 117 | 19595 | 2891 | 15738 | 17560 | 19341 | 21701 | 22926 |
| Fat (lbs) | 50 | 743 | 100 | 603 | 674 | 755 | 810 | 885 |
| Protein (lbs) | 50 | 663 | 82 | 556 | 598 | 665 | 715 | 775 |
| Fat (%) | 58 | 3.5 | 0.3 | 3.3 | 3.4 | 3.5 | 3.6 | 3.7 |
| Protein (%) | 58 | 3.5 | 0.4 | 3 | 3.1 | 3.1 | 3.2 | 3.3 |
Table 5. Average Daily Milk Production by Stage of Lactation for the Northeast Region by Herd Milk Production Level.
| Stage of Lactation (Days) | |||||||
|---|---|---|---|---|---|---|---|
| Herd Average (lbs) | Lactation | 1-40 | 41 – 100 | 101 – 199 | 200 – 305 | 306+ | Avg |
| 14000 – 14999 | 1 | 48 | 48 | 44 | 35 | 30 | 39 |
| 2 | 61 | 58 | 47 | 35 | 29 | 43 | |
| 3+ | 65 | 60 | 49 | 38 | 29 | 46 | |
| All | 57 | 55 | 47 | 36 | 29 | 43 | |
| 15000 – 15999 | 1 | 50 | 49 | 45 | 38 | 32 | 42 |
| 2 | 63 | 60 | 48 | 38 | 31 | 46 | |
| 3+ | 67 | 64 | 52 | 39 | 31 | 48 | |
| All | 61 | 59 | 50 | 38 | 31 | 46 | |
| 16000 – 16999 | 1 | 52 | 53 | 49 | 41 | 34 | 45 |
| 2 | 66 | 64 | 53 | 43 | 34 | 50 | |
| 3+ | 72 | 72 | 56 | 42 | 33 | 54 | |
| All | 63 | 64 | 54 | 42 | 34 | 50 | |
| 17000 – 17999 | 1 | 54 | 56 | 52 | 44 | 36 | 48 |
| 2 | 71 | 68 | 58 | 45 | 35 | 54 | |
| 3+ | 75 | 73 | 60 | 46 | 34 | 57 | |
| All | 67 | 68 | 57 | 45 | 35 | 54 | |
| 18000 – 18999 | 1 | 56 | 59 | 54 | 47 | 40 | 50 |
| 2 | 73 | 71 | 61 | 48 | 37 | 58 | |
| 3+ | 77 | 78 | 64 | 48 | 36 | 61 | |
| All | 70 | 71 | 60 | 48 | 38 | 57 | |
| 19000 – 19999 | 1 | 58 | 62 | 57 | 50 | 43 | 53 |
| 2 | 77 | 76 | 65 | 51 | 39 | 61 | |
| 3+ | 81 | 81 | 67 | 51 | 39 | 64 | |
| All | 72 | 74 | 64 | 51 | 40 | 60 | |
| 20000 – 20999 | 1 | 60 | 64 | 60 | 53 | 45 | 56 |
| 2 | 81 | 80 | 67 | 53 | 41 | 64 | |
| 3+ | 84 | 86 | 71 | 54 | 42 | 68 | |
| All | 76 | 77 | 67 | 54 | 43 | 63 | |
| 21000 – 21999 | 1 | 61 | 66 | 62 | 55 | 47 | 58 |
| 2 | 83 | 82 | 72 | 56 | 44 | 66 | |
| 3+ | 87 | 89 | 74 | 57 | 44 | 71 | |
| All | 78 | 80 | 70 | 56 | 45 | 66 | |
| 22000 – 22999 | 1 | 63 | 68 | 66 | 59 | 50 | 61 |
| 2 | 86 | 86 | 75 | 61 | 47 | 70 | |
| 3+ | 90 | 92 | 78 | 60 | 47 | 74 | |
| All | 80 | 83 | 73 | 60 | 48 | 69 | |
| 23000 – 23999 | 1 | 65 | 72 | 68 | 62 | 53 | 64 |
| 2 | 88 | 90 | 79 | 62 | 50 | 73 | |
| 3+ | 93 | 95 | 82 | 64 | 50 | 78 | |
| All | 81 | 86 | 76 | 63 | 51 | 72 | |
| 24000 – 24999 | 1 | 66 | 74 | 72 | 65 | 56 | 67 |
| 2 | 89 | 93 | 82 | 66 | 53 | 77 | |
| 3+ | 95 | 98 | 85 | 68 | 52 | 81 | |
| All | 83 | 89 | 80 | 66 | 54 | 75 | |
| 25000 – 25999 | 1 | 68 | 76 | 76 | 69 | 61 | 70 |
| 2 | 93 | 96 | 85 | 70 | 55 | 80 | |
| 3+ | 96 | 101 | 89 | 72 | 56 | 84 | |
| All | 85 | 91 | 83 | 70 | 58 | 78 | |
| 26000 – 26999 | 1 | 67 | 79 | 79 | 71 | 62 | 72 |
| 2 | 94 | 97 | 90 | 73 | 58 | 83 | |
| 3+ | 100 | 106 | 94 | 76 | 60 | 88 | |
| All | 85 | 94 | 87 | 73 | 61 | 81 | |
| 27000+ | 1 | 74 | 83 | 82 | 76 | 67 | 77 |
| 2 | 98 | 106 | 97 | 81 | 64 | 89 | |
| 3+ | 103 | 108 | 97 | 81 | 67 | 91 | |
| All | 90 | 98 | 92 | 79 | 66 | 85 | |
Table 6. Average Daily Milk Production by Stage of Lactation for the Mid-South Region by Herd Milk Production Level.
| Stage of Lactation (Days) | |||||||
|---|---|---|---|---|---|---|---|
| Herd Average (lbs) | Lactation | 1-40 | 41 – 100 | 101 – 199 | 200 – 305 | 306+ | Avg |
| 14000 – 14999 | 1 | 47 | 49 | 46 | 41 | 35 | 42 |
| 2 | 56 | 57 | 49 | 40 | 32 | 46 | |
| 3+ | 60 | 60 | 52 | 41 | 34 | 49 | |
| All | 56 | 58 | 50 | 41 | 34 | 47 | |
| 15000 – 15999 | 1 | 47 | 49 | 47 | 42 | 37 | 44 |
| 2 | 62 | 59 | 54 | 44 | 36 | 51 | |
| 3+ | 64 | 64 | 56 | 45 | 35 | 54 | |
| All | 60 | 60 | 53 | 44 | 36 | 51 | |
| 16000 – 16999 | 1 | 49 | 53 | 51 | 46 | 39 | 48 |
| 2 | 66 | 64 | 57 | 47 | 38 | 55 | |
| 3+ | 70 | 69 | 60 | 48 | 38 | 59 | |
| All | 63 | 64 | 57 | 47 | 39 | 55 | |
| 17000 – 17999 | 1 | 52 | 56 | 53 | 48 | 40 | 49 |
| 2 | 69 | 66 | 59 | 48 | 40 | 56 | |
| 3+ | 71 | 72 | 62 | 49 | 38 | 60 | |
| All | 65 | 67 | 59 | 48 | 39 | 56 | |
| 18000 – 18999 | 1 | 56 | 60 | 57 | 52 | 44 | 54 |
| 2 | 72 | 74 | 65 | 52 | 42 | 62 | |
| 3+ | 76 | 78 | 67 | 53 | 42 | 65 | |
| All | 69 | 71 | 64 | 52 | 43 | 60 | |
| 19000 – 19999 | 1 | 57 | 62 | 58 | 54 | 46 | 55 |
| 2 | 75 | 75 | 67 | 53 | 43 | 63 | |
| 3+ | 79 | 80 | 69 | 54 | 43 | 66 | |
| All | 71 | 73 | 65 | 54 | 44 | 62 | |
| 20000 – 20999 | 1 | 59 | 65 | 62 | 57 | 47 | 58 |
| 2 | 78 | 80 | 71 | 58 | 45 | 67 | |
| 3+ | 82 | 84 | 73 | 59 | 46 | 70 | |
| All | 73 | 77 | 69 | 58 | 46 | 65 | |
| 21000 – 21999 | 1 | 60 | 66 | 65 | 60 | 50 | 61 |
| 2 | 82 | 82 | 73 | 60 | 48 | 70 | |
| 3+ | 85 | 87 | 77 | 61 | 49 | 74 | |
| All | 76 | 80 | 72 | 60 | 50 | 68 | |
| 22000 – 22999 | 1 | 62 | 69 | 67 | 61 | 52 | 63 |
| 2 | 85 | 86 | 75 | 62 | 50 | 73 | |
| 3+ | 89 | 90 | 78 | 62 | 51 | 76 | |
| All | 78 | 81 | 74 | 62 | 51 | 70 | |
| 23000 – 23999 | 1 | 65 | 72 | 71 | 65 | 56 | 66 |
| 2 | 87 | 88 | 79 | 66 | 52 | 76 | |
| 3+ | 90 | 94 | 83 | 68 | 54 | 79 | |
| All | 80 | 84 | 78 | 66 | 54 | 73 | |
| 24000+ | 1 | 70 | 76 | 77 | 71 | 61 | 72 |
| 2 | 90 | 94 | 84 | 71 | 60 | 81 | |
| 3+ | 96 | 98 | 89 | 72 | 58 | 85 | |
| All | 85 | 90 | 83 | 72 | 60 | 78 | |
Table 7. Average Daily Milk Production by Stage of Lactation for the Midwest Region by Herd Milk Production Level.
| Stage of Lactation (Days) | |||||||
|---|---|---|---|---|---|---|---|
| Herd Average (lbs) | Lactation | 1-40 | 41 – 100 | 101 – 199 | 200 – 305 | 306+ | Avg |
| 14000 – 14999 | 1 | 47 | 49 | 44 | 38 | 34 | 40 |
| 2 | 61 | 56 | 48 | 40 | 34 | 46 | |
| 3+ | 62 | 60 | 50 | 39 | 31 | 48 | |
| All | 58 | 56 | 48 | 39 | 33 | 45 | |
| 15000 – 15999 | 1 | 49 | 51 | 47 | 43 | 35 | 44 |
| 2 | 62 | 60 | 52 | 43 | 36 | 50 | |
| 3+ | 69 | 66 | 55 | 44 | 35 | 53 | |
| All | 61 | 60 | 52 | 44 | 35 | 50 | |
| 16000 – 16999 | 1 | 50 | 54 | 50 | 45 | 38 | 47 |
| 2 | 66 | 65 | 56 | 44 | 36 | 52 | |
| 3+ | 70 | 68 | 58 | 46 | 36 | 55 | |
| All | 62 | 63 | 55 | 46 | 36 | 52 | |
| 17000 – 17999 | 1 | 54 | 57 | 53 | 48 | 41 | 50 |
| 2 | 68 | 67 | 58 | 49 | 38 | 55 | |
| 3+ | 73 | 73 | 61 | 48 | 37 | 59 | |
| All | 65 | 67 | 58 | 48 | 39 | 55 | |
| 18000 – 18999 | 1 | 55 | 61 | 56 | 51 | 43 | 53 |
| 2 | 72 | 72 | 62 | 50 | 39 | 58 | |
| 3+ | 77 | 76 | 65 | 51 | 39 | 62 | |
| All | 68 | 70 | 62 | 51 | 41 | 58 | |
| 19000 – 19999 | 1 | 57 | 63 | 59 | 53 | 44 | 55 |
| 2 | 74 | 76 | 66 | 53 | 41 | 62 | |
| 3+ | 78 | 80 | 68 | 54 | 41 | 64 | |
| All | 69 | 73 | 65 | 53 | 42 | 60 | |
| 20000 – 20999 | 1 | 60 | 64 | 62 | 57 | 48 | 58 |
| 2 | 78 | 80 | 69 | 56 | 44 | 65 | |
| 3+ | 81 | 83 | 72 | 56 | 44 | 68 | |
| All | 72 | 76 | 68 | 56 | 46 | 64 | |
| 21000 – 21999 | 1 | 61 | 68 | 64 | 59 | 51 | 61 |
| 2 | 81 | 83 | 72 | 59 | 46 | 68 | |
| 3+ | 84 | 88 | 75 | 59 | 46 | 71 | |
| All | 75 | 79 | 71 | 59 | 48 | 66 | |
| 22000 – 22999 | 1 | 62 | 69 | 67 | 62 | 53 | 63 |
| 2 | 85 | 85 | 76 | 62 | 50 | 71 | |
| 3+ | 88 | 90 | 79 | 63 | 49 | 75 | |
| All | 77 | 81 | 74 | 62 | 51 | 69 | |
| 23000 – 23999 | 1 | 63 | 71 | 70 | 65 | 56 | 66 |
| 2 | 88 | 88 | 79 | 65 | 51 | 75 | |
| 3+ | 90 | 94 | 82 | 66 | 52 | 78 | |
| All | 80 | 84 | 77 | 65 | 53 | 72 | |
| 24000 – 24999 | 1 | 65 | 74 | 73 | 67 | 57 | 68 |
| 2 | 92 | 94 | 82 | 68 | 52 | 78 | |
| 3+ | 93 | 99 | 86 | 68 | 54 | 82 | |
| All | 82 | 88 | 81 | 68 | 55 | 75 | |
| 25000 – 25999 | 1 | 65 | 76 | 76 | 71 | 61 | 70 |
| 2 | 94 | 95 | 86 | 71 | 56 | 81 | |
| 3+ | 97 | 100 | 89 | 75 | 57 | 84 | |
| All | 85 | 90 | 84 | 72 | 58 | 78 | |
| 26000 – 26999 | 1 | 67 | 79 | 81 | 75 | 65 | 74 |
| 2 | 96 | 98 | 91 | 77 | 62 | 86 | |
| 3+ | 99 | 105 | 95 | 79 | 62 | 89 | |
| All | 87 | 93 | 88 | 77 | 63 | 82 | |
| 27000+ | 1 | 73 | 83 | 85 | 79 | 68 | 78 |
| 2 | 98 | 108 | 96 | 81 | 63 | 90 | |
| 3+ | 104 | 111 | 100 | 80 | 64 | 94 | |
| All | 90 | 100 | 94 | 80 | 66 | 86 | |
Table 8. Average Daily Milk Production by Stage of Lactation for the South Region by Herd Milk Production Level.
| Stage of Lactation (Days) | |||||||
|---|---|---|---|---|---|---|---|
| Herd Average (lbs) | Lactation | 1-40 | 41 – 100 | 101 – 199 | 200 – 305 | 306+ | Avg |
| 14000 – 14999 | 1 | 46 | 49 | 45 | 40 | 35 | 43 |
| 2 | 61 | 58 | 51 | 41 | 33 | 49 | |
| 3+ | 63 | 62 | 54 | 41 | 34 | 53 | |
| All | 59 | 58 | 51 | 41 | 34 | 49 | |
| 15000 – 15999 | 1 | 47 | 51 | 48 | 43 | 36 | 44 |
| 2 | 63 | 61 | 53 | 42 | 35 | 52 | |
| 3+ | 63 | 66 | 57 | 45 | 33 | 56 | |
| All | 60 | 61 | 53 | 44 | 34 | 51 | |
| 16000 – 16999 | 1 | 49 | 55 | 51 | 46 | 39 | 48 |
| 2 | 63 | 66 | 57 | 46 | 36 | 55 | |
| 3+ | 67 | 69 | 59 | 48 | 37 | 58 | |
| All | 62 | 65 | 56 | 47 | 37 | 54 | |
| 17000 – 17999 | 1 | 51 | 58 | 54 | 48 | 41 | 50 |
| 2 | 66 | 70 | 60 | 48 | 35 | 58 | |
| 3+ | 71 | 72 | 64 | 48 | 38 | 61 | |
| All | 64 | 69 | 59 | 48 | 39 | 56 | |
| 18000 – 18999 | 1 | 53 | 61 | 58 | 52 | 42 | 53 |
| 2 | 71 | 73 | 65 | 51 | 40 | 62 | |
| 3+ | 74 | 77 | 67 | 51 | 41 | 64 | |
| All | 68 | 71 | 64 | 52 | 71 | 60 | |
| 19000 – 19999 | 1 | 56 | 63 | 61 | 56 | 45 | 56 |
| 2 | 77 | 77 | 69 | 55 | 43 | 66 | |
| 3+ | 79 | 81 | 71 | 57 | 43 | 68 | |
| All | 72 | 74 | 66 | 56 | 44 | 6 | |
| 20000 – 20999 | 1 | 57 | 65 | 63 | 57 | 48 | 58 |
| 2 | 79 | 80 | 72 | 55 | 44 | 67 | |
| 3+ | 81 | 83 | 72 | 56 | 45 | 70 | |
| All | 73 | 76 | 69 | 57 | 46 | 65 | |
| 21000 – 21999 | 1 | 59 | 67 | 65 | 61 | 48 | 60 |
| 2 | 78 | 82 | 74 | 61 | 49 | 70 | |
| 3+ | 81 | 86 | 75 | 60 | 48 | 71 | |
| All | 73 | 78 | 70 | 60 | 49 | 66 | |
| 22000+ | 1 | 62 | 72 | 71 | 67 | 55 | 66 |
| 2 | 85 | 89 | 80 | 66 | 54 | 76 | |
| 3+ | 90 | 92 | 82 | 67 | 53 | 79 | |
| All | 80 | 85 | 77 | 67 | 54 | 73 | |
Table 9. Average Daily Fat and Protein Percent for the Northeast Region by Herd Milk Production Level.
| Stage of Lactation (Days) | |||||||
|---|---|---|---|---|---|---|---|
| Herd Average (lbs) | Lactation | 1-40 | 41 – 100 | 101 – 199 | 200 – 305 | 306+ | Avg |
| Percent (%) | |||||||
| 14000 – 14999 | Fat | 4.19 | 3.75 | 3.81 | 4.05 | 4.17 | 3.96 |
| Protein | 2.95 | 2.77 | 3.02 | 3.26 | 3.51 | 3.11 | |
| 15000 – 15999 | Fat | 4.21 | 3.77 | 3.86 | 4.05 | 4.24 | 3.98 |
| Protein | 3.03 | 2.83 | 3.06 | 3.32 | 3.57 | 3.16 | |
| 16000 – 16999 | Fat | 4.18 | 3.75 | 3.80 | 4.02 | 4.24 | 3.96 |
| Protein | 2.98 | 2.83 | 3.06 | 3.32 | 3.55 | 3.15 | |
| 17000 – 17999 | Fat | 4.13 | 3.74 | 3.75 | 3.97 | 4.14 | 3.91 |
| Protein | 2.98 | 2.83 | 3.04 | 3.29 | 3.52 | 3.13 | |
| 18000 – 18999 | Fat | 4.14 | 3.72 | 3.76 | 3.99 | 4.15 | 3.92 |
| Protein | 3.00 | 2.86 | 3.08 | 3.32 | 3.54 | 3.15 | |
| 19000 – 19999 | Fat | 4.15 | 3.68 | 3.72 | 3.96 | 4.12 | 3.89 |
| Protein | 2.99 | 2.85 | 3.06 | 3.30 | 3.51 | 3.14 | |
| 20000 – 20999 | Fat | 4.08 | 3.65 | 3.70 | 3.93 | 4.12 | 3.85 |
| Protein | 2.97 | 2.83 | 3.05 | 3.29 | 3.51 | 3.12 | |
| 21000 – 21999 | Fat | 4.10 | 3.62 | 3.68 | 3.91 | 4.09 | 3.84 |
| Protein | 2.97 | 2.83 | 3.04 | 3.29 | 3.49 | 3.12 | |
| 22000 – 22999 | Fat | 4.04 | 3.63 | 3.67 | 3.88 | 4.07 | 3.82 |
| Protein | 2.97 | 2.83 | 3.04 | 3.27 | 3.48 | 3.11 | |
| 23000 – 23999 | Fat | 4.06 | 3.62 | 3.64 | 3.87 | 4.07 | 3.80 |
| Protein | 2.97 | 2.85 | 3.05 | 3.28 | 3.48 | 3.12 | |
| 24000 – 24999 | Fat | 4.03 | 3.55 | 3.58 | 3.78 | 3.99 | 3.74 |
| Protein | 2.96 | 2.83 | 3.02 | 3.24 | 3.44 | 3.09 | |
| 25000 – 25999 | Fat | 3.95 | 3.53 | 3.58 | 3.77 | 3.95 | 3.72 |
| Protein | 2.94 | 2.82 | 3.02 | 3.23 | 3.43 | 3.08 | |
| 26000 – 26999 | Fat | 4.01 | 3.53 | 3.54 | 3.76 | 3.92 | 3.70 |
| Protein | 2.99 | 2.82 | 3.01 | 3.23 | 3.43 | 3.09 | |
| 27000+ | Fat | 3.96 | 3.54 | 3.56 | 3.71 | 3.96 | 3.71 |
| Protein | 2.95 | 2.81 | 3.01 | 3.21 | 3.41 | 3.09 | |
Table 10. Average Daily Fat and Protein Percent for the Midsouth Region by Herd Milk Production Level.
| Stage of Lactation (Days) | |||||||
|---|---|---|---|---|---|---|---|
| Herd Average (lbs) | Lactation | 1-40 | 41 – 100 | 101 – 199 | 200 – 305 | 306+ | Avg |
| Percent (%) | |||||||
| 14000 – 14999 | Fat | 4.02 | 3.78 | 3.81 | 4.11 | 4.21 | 3.97 |
| Protein | 3.13 | 3.02 | 3.22 | 3.48 | 3.62 | 3.31 | |
| 15000 – 15999 | Fat | 3.96 | 3.71 | 3.78 | 4.06 | 4.13 | 3.88 |
| Protein | 3.17 | 3.00 | 3.17 | 3.42 | 3.58 | 3.23 | |
| 16000 – 16999 | Fat | 3.99 | 3.71 | 3.76 | 4.02 | 4.15 | 3.87 |
| Protein | 3.17 | 3.03 | 3.21 | 3.44 | 3.59 | 3.26 | |
| 17000 – 17999 | Fat | 3.97 | 3.68 | 3.70 | 3.94 | 4.12 | 3.83 |
| Protein | 3.13 | 3.02 | 3.19 | 3.40 | 3.55 | 3.23 | |
| 18000 – 18999 | Fat | 4.02 | 3.65 | 3.73 | 3.97 | 4.12 | 3.86 |
| Protein | 3.12 | 2.97 | 3.16 | 3.40 | 3.57 | 3.22 | |
| 19000 – 19999 | Fat | 3.99 | 3.63 | 3.66 | 3.92 | 4.10 | 3.83 |
| Protein | 3.11 | 2.99 | 3.15 | 3.37 | 3.55 | 3.22 | |
| 20000 – 20999 | Fat | 4.07 | 3.64 | 3.67 | 3.89 | 4.07 | 3.83 |
| Protein | 3.08 | 2.96 | 3.12 | 3.35 | 3.51 | 3.19 | |
| 21000 – 21999 | Fat | 4.07 | 3.63 | 3.67 | 3.92 | 4.12 | 3.83 |
| Protein | 3.10 | 2.96 | 3.12 | 3.36 | 3.52 | 3.19 | |
| 22000 – 22999 | Fat | 4.08 | 3.64 | 3.65 | 3.91 | 4.04 | 3.81 |
| Protein | 3.06 | 2.93 | 3.10 | 3.33 | 3.46 | 3.16 | |
| 23000 – 23999 | Fat | 4.04 | 3.59 | 3.56 | 3.79 | 4.02 | 3.77 |
| Protein | 3.05 | 2.92 | 3.05 | 3.29 | 3.47 | 3.14 | |
| 24000+ | Fat | 3.90 | 3.54 | 3.54 | 3.74 | 3.98 | 3.69 |
| Protein | 3.03 | 2.93 | 3.11 | 3.31 | 3.48 | 3.16 | |
Table 11. Average Daily Fat and Protein Percent for the Midwest Region by Herd Milk
| Stage of Lactation (Days) | |||||||
|---|---|---|---|---|---|---|---|
| Herd Average (lbs) | Lactation | 1-40 | 41 – 100 | 101 – 199 | 200 – 305 | 306+ | Avg |
| Percent (%) | |||||||
| 14000 – 14999 | Fat | 4.35 | 3.96 | 3.98 | 4.22 | 4.31 | 4.14 |
| Protein | 3.07 | 2.97 | 3.19 | 3.4 | 3.56 | 3.25 | |
| 15000 – 15999 | Fat | 4.28 | 3.87 | 3.93 | 4.13 | 4.25 | 4.05 |
| Protein | 3.09 | 2.98 | 3.2 | 3.41 | 3.59 | 3.25 | |
| 16000 – 16999 | Fat | 4.26 | 3.84 | 3.9 | 4.08 | 4.24 | 4.02 |
| Protein | 3.11 | 2.99 | 3.18 | 3.39 | 3.59 | 3.24 | |
| 17000 – 17999 | Fat | 4.28 | 3.87 | 3.89 | 4.1 | 4.22 | 4.04 |
| Protein | 3.07 | 2.96 | 3.16 | 3.38 | 3.55 | 3.23 | |
| 18000 – 18999 | Fat | 4.33 | 3.91 | 3.9 | 4.11 | 4.18 | 4.04 |
| Protein | 3.08 | 2.96 | 3.16 | 3.37 | 3.53 | 3.22 | |
| 19000 – 19999 | Fat | 4.28 | 3.8 | 3.83 | 4.02 | 4.15 | 3.97 |
| Protein | 3.06 | 2.94 | 3.14 | 3.35 | 3.53 | 3.2 | |
| 20000 – 20999 | Fat | 4.29 | 3.79 | 3.81 | 3.99 | 4.11 | 3.96 |
| Protein | 3.04 | 2.94 | 3.13 | 3.33 | 3.51 | 3.18 | |
| 21000 – 21999 | Fat | 4.29 | 3.8 | 3.79 | 3.96 | 4.1 | 3.95 |
| Protein | 3.05 | 2.94 | 3.12 | 3.33 | 3.5 | 3.18 | |
| 22000 – 22999 | Fat | 4.3 | 3.8 | 3.77 | 3.94 | 4.07 | 3.93 |
| Protein | 3.06 | 2.93 | 3.12 | 3.31 | 3.46 | 3.17 | |
| 23000 – 23999 | Fat | 4.22 | 3.75 | 3.74 | 3.9 | 4.02 | 3.89 |
| Protein | 3.04 | 2.91 | 3.09 | 3.3 | 3.46 | 3.15 | |
| 24000 – 24999 | Fat | 4.31 | 3.74 | 3.7 | 3.87 | 4.05 | 3.88 |
| Protein | 3 | 2.87 | 3.06 | 3.25 | 3.44 | 3.12 | |
| 25000 – 25999 | Fat | 4.29 | 3.78 | 3.78 | 3.91 | 4.03 | 3.91 |
| Protein | 3.01 | 2.92 | 3.08 | 3.26 | 3.44 | 3.13 | |
| 26000 – 26999 | Fat | 4.23 | 3.68 | 3.64 | 3.82 | 3.97 | 3.83 |
| Protein | 3.01 | 2.89 | 3.05 | 3.23 | 3.38 | 3.11 | |
| 27000+ | Fat | 4.16 | 3.66 | 3.59 | 3.77 | 3.89 | 3.77 |
| Protein | 3.02 | 2.86 | 3.03 | 3.22 | 3.38 | 3.1 | |
Table 12. Average Daily Fat and Protein Percent for the South Region by Herd Milk Production Level.
| Stage of Lactation (Days) | |||||||
|---|---|---|---|---|---|---|---|
| Herd Average (lbs) | Lactation | 1-40 | 41 – 100 | 101 – 199 | 200 – 305 | 306+ | Avg |
| Percent (%) | |||||||
| 14000 – 14999 | Fat | 3.72 | 3.59 | 3.63 | 3.94 | 4.04 | 3.7 |
| Protein | 3.14 | 3 | 3.12 | 3.4 | 3.57 | 3.16 | |
| 15000 – 15999 | Fat | 3.66 | 3.43 | 3.4 | 3.82 | 3.97 | 3.59 |
| Protein | 3.15 | 3 | 3.14 | 3.43 | 3.56 | 3.2 | |
| 16000 – 16999 | Fat | 3.87 | 3.59 | 3.52 | 3.74 | 3.92 | 3.57 |
| Protein | 3.09 | 2.96 | 3.08 | 3.3 | 3.46 | 3.04 | |
| 17000 – 17999 | Fat | 3.82 | 3.54 | 3.56 | 3.95 | 4.1 | 3.72 |
| Protein | 3.12 | 2.96 | 3.11 | 3.36 | 3.53 | 3.15 | |
| 18000 – 18999 | Fat | 3.82 | 3.57 | 3.58 | 3.86 | 4 | 3.72 |
| Protein | 3.11 | 2.99 | 3.14 | 3.4 | 3.53 | 3.19 | |
| 19000 – 19999 | Fat | 3.82 | 3.55 | 3.61 | 3.86 | 4.03 | 3.73 |
| Protein | 3.08 | 2.95 | 3.12 | 3.36 | 3.52 | 3.18 | |
| 20000 – 20999 | Fat | 3.91 | 3.58 | 3.62 | 3.86 | 4.07 | 3.78 |
| Protein | 3.14 | 2.98 | 3.15 | 3.38 | 3.55 | 3.22 | |
| 21000 – 21999 | Fat | 3.98 | 3.64 | 3.69 | 3.9 | 4.12 | 3.85 |
| Protein | 3.11 | 2.97 | 3.1 | 3.35 | 3.51 | 3.19 | |
| 22000+ | Fat | 3.93 | 3.61 | 3.59 | 3.76 | 4.01 | 3.74 |
| Protein | 3.11 | 2.96 | 3.1 | 3.33 | 3.49 | 3.17 | |
Table 13. Summit Milk by Region and Herd Milk Production Level.
| Northeast | ||||||||
|---|---|---|---|---|---|---|---|---|
| Lactation (lbs) | Ratio | |||||||
| Herd Average (lbs) | N | 1 | 2 | 3+ | Avg | 1:2 | 2:3 | 1:3 |
| 14000 | 74 | 53 | 65 | 70 | 64 | 82 | 93 | 76 |
| 15000 | 138 | 55 | 66 | 72 | 66 | 83 | 92 | 76 |
| 16000 | 210 | 57 | 71 | 77 | 70 | 80 | 92 | 74 |
| 17000 | 353 | 60 | 75 | 81 | 73 | 80 | 92 | 74 |
| 18000 | 450 | 63 | 79 | 84 | 76 | 80 | 94 | 75 |
| 19000 | 586 | 65 | 82 | 88 | 79 | 79 | 93 | 74 |
| 20000 | 608 | 67 | 86 | 92 | 82 | 73 | 93 | 73 |
| 21000 | 648 | 70 | 89 | 95 | 85 | 79 | 94 | 74 |
| 22000 | 479 | 72 | 92 | 97 | 87 | 78 | 95 | 74 |
| 23000 | 384 | 74 | 96 | 101 | 90 | 77 | 95 | 73 |
| 24000 | 272 | 76 | 99 | 104 | 92 | 77 | 95 | 73 |
| 25000 | 162 | 79 | 102 | 107 | 95 | 77 | 95 | 74 |
| 26000 | 94 | 80 | 104 | 111 | 97 | 77 | 94 | 72 |
| 27000 | 98 | 86 | 110 | 115 | 102 | 78 | 96 | 75 |
| Mid-South | ||||||||
|---|---|---|---|---|---|---|---|---|
| Lactation (lbs) | Ratio | |||||||
| Herd Average (lbs) | N | 1 | 2 | 3+ | Avg | 1:2 | 2:3 | 1:3 |
| 14000 | 82 | 53 | 63 | 68 | 63 | 84 | 93 | 78 |
| 15000 | 122 | 53 | 65 | 70 | 64 | 82 | 93 | 76 |
| 16000 | 164 | 56 | 68 | 75 | 68 | 82 | 91 | 75 |
| 17000 | 176 | 60 | 72 | 77 | 70 | 83 | 94 | 78 |
| 18000 | 227 | 63 | 77 | 82 | 74 | 82 | 94 | 77 |
| 19000 | 225 | 65 | 80 | 85 | 77 | 81 | 94 | 76 |
| 20000 | 202 | 67 | 84 | 89 | 80 | 80 | 94 | 75 |
| 21000 | 201 | 69 | 87 | 92 | 83 | 79 | 94 | 75 |
| 22000 | 133 | 71 | 90 | 95 | 85 | 79 | 95 | 75 |
| 23000 | 60 | 72 | 94 | 99 | 88 | 76 | 95 | 73 |
| 24000 | 97 | 79 | 99 | 104 | 93 | 80 | 95 | 76 |
| Mid-West | ||||||||
|---|---|---|---|---|---|---|---|---|
| Lactation (lbs) | Ratio | |||||||
| Herd Average (lbs) | N | 1 | 2 | 3+ | Avg | 1:2 | 2:3 | 1:3 |
| 14000 | 82 | 53 | 63 | 68 | 62 | 84 | 93 | 78 |
| 15000 | 156 | 55 | 66 | 72 | 65 | 83 | 92 | 76 |
| 16000 | 269 | 58 | 70 | 74 | 68 | 83 | 94 | 78 |
| 17000 | 320 | 61 | 74 | 79 | 71 | 82 | 90 | 73 |
| 18000 | 383 | 63 | 77 | 82 | 74 | 82 | 94 | 77 |
| 19000 | 449 | 65 | 81 | 86 | 77 | 80 | 94 | 76 |
| 20000 | 488 | 68 | 85 | 89 | 80 | 80 | 96 | 76 |
| 21000 | 416 | 70 | 88 | 93 | 83 | 80 | 95 | 75 |
| 22000 | 365 | 72 | 91 | 96 | 86 | 79 | 95 | 75 |
| 23000 | 265 | 74 | 94 | 99 | 88 | 79 | 95 | 75 |
| 24000 | 185 | 76 | 98 | 103 | 91 | 78 | 95 | 74 |
| 25000 | 119 | 78 | 101 | 106 | 94 | 77 | 95 | 74 |
| 26000 | 77 | 81 | 105 | 110 | 97 | 77 | 95 | 74 |
| 27000 | 91 | 86 | 112 | 116 | 103 | 77 | 97 | 74 |
| South | ||||||||
|---|---|---|---|---|---|---|---|---|
| Lactation (lbs) | Ratio | |||||||
| Herd Average (lbs) | N | 1 | 2 | 3+ | Avg | 1:2 | 2:3 | 1:3 |
| 14000 | 54 | 53 | 62 | 68 | 62 | 85 | 91 | 78 |
| 15000 | 73 | 55 | 65 | 71 | 64 | 85 | 92 | 71 |
| 16000 | 76 | 58 | 70 | 75 | 68 | 83 | 93 | 77 |
| 17000 | 89 | 61 | 74 | 78 | 71 | 82 | 95 | 78 |
| 18000 | 85 | 63 | 78 | 82 | 74 | 81 | 95 | 77 |
| 19000 | 72 | 65 | 81 | 85 | 76 | 80 | 95 | 76 |
| 20000 | 73 | 68 | 86 | 90 | 80 | 79 | 96 | 76 |
| 21000 | 53 | 69 | 86 | 92 | 82 | 80 | 93 | 75 |
| 22000 | 103 | 74 | 92 | 98 | 87 | 80 | 94 | 76 |
Table 14. Reasons Cows Left the Herd in the Northeast Region and Herd Milk Production Level.
| Herd Average (lbs) | N | Entering % | Leaving % | Died | Dairy | Low Prod | Repro | Mastitis | Udder | Feet and Legs | Injury | Disease | Not Reported |
|---|---|---|---|---|---|---|---|---|---|---|---|---|---|
| as a % of left herd cows | |||||||||||||
| 14000 | 75 | 29 | 31 | 19 | 4 | 5 | 20 | 8 | 0.5 | 6 | 34 | 1 | 2 |
| 15000 | 137 | 30 | 31 | 13 | 4 | 7 | 18 | 9 | 0.8 | 4 | 39 | 2 | 2 |
| 16000 | 206 | 32 | 31 | 14 | 3 | 7 | 20 | 8 | 0.7 | 5 | 37 | 2 | 3 |
| 17000 | 351 | 32 | 32 | 13 | 5 | 7 | 20 | 9 | 2 | 6 | 32 | 2 | 3 |
| 18000 | 447 | 33 | 32 | 12 | 4 | 7 | 20 | 10 | 2 | 6 | 35 | 2 | 2 |
| 19000 | 577 | 34 | 32 | 11 | 5 | 8 | 19 | 10 | 2 | 6 | 33 | 3 | 2 |
| 20000 | 605 | 34 | 32 | 11 | 6 | 8 | 20 | 11 | 2 | 6 | 30 | 3 | 3 |
| 21000 | 640 | 34 | 33 | 11 | 6 | 8 | 21 | 12 | 2 | 7 | 28 | 3 | 2 |
| 22000 | 469 | 35 | 32 | 10 | 6 | 8 | 20 | 12 | 3 | 6 | 28 | 3 | 2 |
| 23000 | 380 | 37 | 34 | 9 | 9 | 7 | 20 | 14 | 3 | 6 | 25 | 3 | 2 |
| 24000 | 268 | 38 | 34 | 11 | 8 | 7 | 19 | 14 | 2 | 7 | 27 | 3 | 2 |
| 25000 | 159 | 38 | 35 | 10 | 9 | 7 | 19 | 15 | 3 | 6 | 27 | 2 | 2 |
| 26000 | 94 | 39 | 35 | 10 | 10 | 7 | 21 | 16 | 4 | 7 | 21 | 2 | 0.8 |
| 27000 | 95 | 40 | 36 | 9 | 12 | 8 | 20 | 13 | 3 | 6 | 26 | 3 | 1 |
Table 15. Reasons Cows Left the Herd in the Mid-South Region and Herd Milk Production Level.
| Herd Average (lbs) | N | Entering % | Leaving % | Died | Dairy | Low Prod | Repro | Mastitis | Udder | Feet and Legs | Injury | Disease | Not Reported |
|---|---|---|---|---|---|---|---|---|---|---|---|---|---|
| as a % of left herd cows | |||||||||||||
| 14000 | 83 | 30 | 31 | 24 | 6 | 8 | 19 | 11 | 2 | 3 | 15 | 1 | 11 |
| 15000 | 120 | 33 | 33 | 21 | 7 | 10 | 18 | 8 | 3 | 4 | 14 | 2 | 13 |
| 16000 | 159 | 36 | 32 | 19 | 6 | 12 | 18 | 10 | 2 | 4 | 15 | 4 | 11 |
| 17000 | 170 | 34 | 32 | 19 | 6 | 11 | 20 | 11 | 3 | 5 | 15 | 3 | 7 |
| 18000 | 219 | 36 | 35 | 18 | 7 | 10 | 19 | 12 | 3 | 6 | 13 | 3 | 9 |
| 19000 | 219 | 36 | 36 | 15 | 7 | 9 | 20 | 13 | 3 | 5 | 17 | 4 | 6 |
| 20000 | 199 | 38 | 36 | 16 | 6 | 8 | 21 | 12 | 3 | 6 | 15 | 4 | 7 |
| 21000 | 192 | 36 | 36 | 14 | 7 | 9 | 22 | 11 | 4 | 7 | 15 | 4 | 6 |
| 22000 | 131 | 41 | 38 | 11 | 10 | 11 | 20 | 13 | 4 | 7 | 15 | 3 | 5 |
| 23000 | 59 | 41 | 39 | 12 | 11 | 12 | 19 | 15 | 5 | 6 | 12 | 4 | 3 |
| 24000 | 92 | 41 | 40 | 13 | 11 | 12 | 18 | 17 | 3 | 6 | 12 | 4 | 3 |
Table 16. Reasons Cows Left the Herd in the Midwest Region and Herd Milk Production Level.
| Herd Average (lbs) | N | Entering % | Leaving % | Died | Dairy | Low Prod | Repro | Mastitis | Udder | Feet and Legs | Injury | Disease | Not Reported |
|---|---|---|---|---|---|---|---|---|---|---|---|---|---|
| as a % of left herd cows | |||||||||||||
| 14000 | 81 | 31 | 32 | 16 | 3 | 10 | 21 | 12 | 2 | 3 | 14 | 5 | 14 |
| 15000 | 150 | 34 | 34 | 17 | 3 | 11 | 18 | 11 | 3 | 3 | 16 | 3 | 14 |
| 16000 | 265 | 35 | 35 | 17 | 3 | 11 | 20 | 12 | 3 | 3 | 16 | 3 | 12 |
| 17000 | 312 | 37 | 36 | 16 | 3 | 12 | 19 | 12 | 2 | 4 | 16 | 4 | 12 |
| 18000 | 373 | 36 | 36 | 16 | 3 | 13 | 20 | 11 | 3 | 4 | 17 | 4 | 8 |
| 19000 | 433 | 38 | 36 | 15 | 3 | 11 | 20 | 12 | 3 | 4 | 18 | 4 | 9 |
| 20000 | 479 | 39 | 38 | 14 | 4 | 11 | 20 | 12 | 3 | 5 | 18 | 4 | 8 |
| 21000 | 401 | 40 | 37 | 14 | 4 | 12 | 21 | 12 | 4 | 5 | 16 | 4 | 8 |
| 22000 | 354 | 39 | 38 | 13 | 6 | 11 | 21 | 12 | 4 | 5 | 15 | 4 | 9 |
| 23000 | 252 | 39 | 37 | 14 | 6 | 11 | 21 | 14 | 4 | 5 | 15 | 4 | 8 |
| 24000 | 179 | 42 | 39 | 13 | 9 | 11 | 21 | 12 | 4 | 5 | 18 | 4 | 4 |
| 25000 | 118 | 40 | 38 | 12 | 8 | 10 | 19 | 13 | 4 | 6 | 15 | 5 | 8 |
| 26000 | 74 | 42 | 39 | 10 | 12 | 10 | 18 | 12 | 4 | 5 | 17 | 5 | 6 |
| 27000 | 89 | 41 | 39 | 12 | 14 | 8 | 17 | 12 | 4 | 5 | 16 | 4 | 7 |
Table 17. Reasons Cows Left the Herd in the South Region and Herd Milk Production Level.
| Herd Average (lbs) | N | Entering % | Leaving % | Died | Dairy | Low Prod | Repro | Mastitis | Udder | Feet and Legs | Injury | Disease | Not Reported |
|---|---|---|---|---|---|---|---|---|---|---|---|---|---|
| as a % of left herd cows | |||||||||||||
| 14000 | 54 | 27 | 31 | 23 | 3 | 12 | 15 | 6 | 3 | 4 | 16 | 2 | 17 |
| 15000 | 71 | 33 | 33 | 22 | 3 | 14 | 24 | 6 | 2 | 4 | 16 | 2 | 6 |
| 16000 | 74 | 35 | 35 | 22 | 2 | 10 | 22 | 7 | 4 | 6 | 13 | 4 | 10 |
| 17000 | 82 | 38 | 36 | 18 | 4 | 12 | 23 | 8 | 3 | 5 | 14 | 3 | 10 |
| 18000 | 81 | 35 | 36 | 22 | 4 | 12 | 22 | 8 | 4 | 6 | 12 | 5 | 6 |
| 19000 | 71 | 39 | 35 | 20 | 3 | 14 | 25 | 8 | 3 | 7 | 11 | 4 | 5 |
| 20000 | 73 | 38 | 37 | 19 | 4 | 12 | 19 | 10 | 3 | 7 | 15 | 4 | 5 |
| 21000 | 52 | 39 | 37 | 18 | 6 | 12 | 23 | 10 | 2 | 9 | 11 | 4 | 4 |
| 22000 | 103 | 38 | 36 | 17 | 6 | 12 | 21 | 11 | 3 | 6 | 14 | 5 | 4 |
Table 18. Age of Herd and Distribution by Region and Herd Milk Production Level
| Northeast | ||||||||
|---|---|---|---|---|---|---|---|---|
| Lactation (months) | Lactation (%) | |||||||
| Herd Average (lbs) | N | 1 | 2 | 3+ | All | 1 | 2 | 3+ |
| 14000 | 73 | 29 | 44 | 75 | 56 | 27 | 22 | 51 |
| 15000 | 74 | 28 | 42 | 74 | 55 | 27 | 28 | 50 |
| 16000 | 138 | 28 | 42 | 73 | 54 | 27 | 23 | 50 |
| 17000 | 211 | 28 | 42 | 71 | 51 | 30 | 25 | 44 |
| 18000 | 354 | 27 | 41 | 70 | 50 | 30 | 25 | 45 |
| 19000 | 451 | 27 | 41 | 70 | 49 | 31 | 26 | 43 |
| 20000 | 609 | 26 | 40 | 68 | 47 | 33 | 26 | 41 |
| 21000 | 648 | 26 | 40 | 67 | 47 | 34 | 26 | 40 |
| 22000 | 479 | 26 | 40 | 66 | 46 | 34 | 26 | 40 |
| 23000 | 384 | 25 | 39 | 66 | 46 | 35 | 27 | 38 |
| 24000 | 272 | 25 | 39 | 65 | 44 | 36 | 27 | 37 |
| 25000 | 162 | 25 | 39 | 64 | 43 | 38 | 27 | 36 |
| 26000 | 94 | 25 | 39 | 64 | 42 | 38 | 27 | 34 |
| 27000+ | 98 | 25 | 40 | 65 | 43 | 38 | 27 | 34 |
| Mid-South | ||||||||
|---|---|---|---|---|---|---|---|---|
| Lactation (months) | Lactation (%) | |||||||
| Herd Average (lbs) | N | 1 | 2 | 3+ | All | 1 | 2 | 3+ |
| 14000 | 83 | 28 | 42 | 74 | 55 | 27 | 24 | 50 |
| 15000 | 122 | 28 | 43 | 73 | 53 | 30 | 23 | 47 |
| 16000 | 164 | 28 | 42 | 72 | 52 | 30 | 24 | 46 |
| 17000 | 176 | 28 | 42 | 72 | 51 | 31 | 25 | 44 |
| 18000 | 227 | 28 | 42 | 71 | 50 | 33 | 26 | 41 |
| 19000 | 225 | 28 | 42 | 70 | 48 | 35 | 27 | 38 |
| 20000 | 202 | 27 | 42 | 68 | 47 | 35 | 27 | 38 |
| 21000 | 201 | 27 | 41 | 68 | 47 | 35 | 26 | 38 |
| 22000 | 133 | 27 | 41 | 68 | 46 | 37 | 27 | 36 |
| 23000 | 60 | 27 | 41 | 38 | 46 | 37 | 27 | 36 |
| 24000 | 97 | 26 | 40 | 66 | 44 | 38 | 28 | 33 |
| Midwest | ||||||||
|---|---|---|---|---|---|---|---|---|
| Lactation (months) | Lactation (%) | |||||||
| Herd Average (lbs) | N | 1 | 2 | 3+ | All | 1 | 2 | 3+ |
| 14000 | 83 | 28 | 42 | 72 | 52 | 29 | 25 | 46 |
| 15000 | 156 | 28 | 42 | 71 | 50 | 32 | 25 | 43 |
| 16000 | 269 | 28 | 42 | 70 | 50 | 32 | 25 | 42 |
| 17000 | 320 | 27 | 41 | 69 | 48 | 34 | 26 | 40 |
| 18000 | 383 | 27 | 41 | 69 | 48 | 34 | 26 | 40 |
| 19000 | 449 | 27 | 41 | 68 | 46 | 36 | 27 | 37 |
| 20000 | 488 | 27 | 41 | 67 | 45 | 37 | 26 | 36 |
| 21000 | 416 | 26 | 40 | 66 | 45 | 38 | 26 | 36 |
| 22000 | 365 | 26 | 40 | 67 | 45 | 38 | 27 | 35 |
| 23000 | 265 | 26 | 40 | 66 | 44 | 39 | 27 | 34 |
| 24000 | 185 | 26 | 40 | 65 | 43 | 39 | 27 | 34 |
| 25000 | 119 | 25 | 39 | 65 | 43 | 39 | 28 | 33 |
| 26000 | 77 | 26 | 40 | 65 | 43 | 40 | 27 | 33 |
| 27000+ | 91 | 25 | 39 | 65 | 42 | 39 | 28 | 33 |
| South | ||||||||
|---|---|---|---|---|---|---|---|---|
| Lactation (months) | Lactation (%) | |||||||
| Herd Average (lbs) | N | 1 | 2 | 3+ | All | 1 | 2 | 3+ |
| 14000 | 54 | 27 | 41 | 72 | 53 | 26 | 25 | 49 |
| 15000 | 73 | 27 | 42 | 72 | 51 | 30 | 25 | 45 |
| 16000 | 76 | 27 | 41 | 71 | 50 | 32 | 26 | 42 |
| 17000 | 89 | 27 | 42 | 70 | 48 | 36 | 26 | 39 |
| 18000 | 85 | 27 | 42 | 69 | 48 | 34 | 28 | 38 |
| 19000 | 72 | 26 | 42 | 68 | 46 | 37 | 26 | 37 |
| 20000 | 74 | 26 | 41 | 67 | 46 | 36 | 27 | 38 |
| 21000 | 53 | 26 | 41 | 68 | 46 | 38 | 27 | 35 |
| 22000 | 103 | 26 | 41 | 67 | 45 | 37 | 28 | 35 |