Introduction
The Dairy Records Management Systems (DRMS), Raleigh, North Carolina, provides information and resources for use in dairy herd management analysis. The DHI-202 Herd Summary Report is a valuable source of information. Many herd management strengths and weaknesses can be uncovered using herd summary data.
The purpose of this bulletin is to provide somatic cell count benchmarks for Holstein herds processed by DRMS. Some examples of using and applying benchmark values are provided. However, this bulletin should be viewed primarily as a comprehensive resource of somatic cell count benchmark values. These benchmarks will be useful to dairy producers, dairy managers, consultants, veterinarians and agribusiness representatives as a first step in the analysis of herd management practices. Conduct a more complete analysis of herd management practices in order to pinpoint specific causes and develop solutions.
Methods
Herd summary information was obtained from the DRMS, Raleigh, NC, for Holstein herds last tested in November or December, 2000. Data analysis was performed using the Statistical Analysis System (SAS) (1).
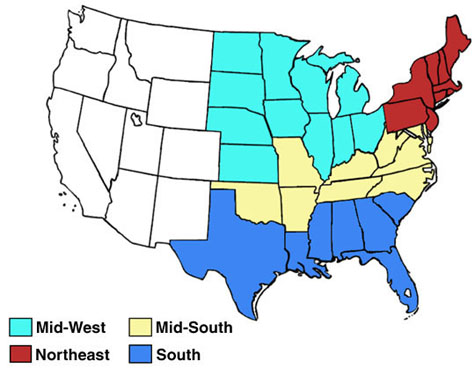 Figure 1. Map of U.S. Showing Four Regions.
Research has shown that management variables may differ by region of the country, herd size and milk production level. Consequently, benchmark values are presented for Northeast, Mid-south, Midwest and South regions (Figure 1). Within regions, further subdivisions are by herd size or rolling herd average milk production. Values in all tables and graphs were limited to herds with a minimum of 25 cows. Minimum milk production for herds included in percentile tables was 12,000 pounds. Note that all analyses and calculations are based on herd average information and not individual cow data. The number of observations mean, standard deviation and percentile ranks were calculated for certain benchmark values. Following are definitions of these terms:
N: The number of observations (herds) included in a specific analysis. Each variable was analyzed separately so N differs depending upon the number of herds having a specific variable.
Mean: The average calculated as the sum of all observations divided by N.
Standard Deviation (SD): A measure of the variability of the observations. The larger the SD the greater the variation is among the observations.
Percentile Rank: Percentiles are defined as a value such that X% fall short of the value and Y% exceed the value. For example, if a benchmark value is at the 75th percentile, then 75% of the herds analyzed had values below and 25% of the herds had values above the benchmark. A herd value at the 75th percentile is in the top 25% of all herds analyzed.
Mastitis and Somatic Cell Counts
Mastitis is generally considered the most costly disease of dairy cattle, averaging $150-$250 per cow per year. Many factors contribute to these costs including decreased income because of subclinical mastitis, reduced production, treatment costs and increased replacement costs.
The cells found in milk consist of about 75 percent white blood cells or leucocytes and about 25 percent epithelial cells. Leucocyte numbers increase in response to bacterial infection and tissue injury and stress. The epithelial cells originate from udder secretory tissue and increase as a result of injury or infection. Since both types of cells originate from within the cow’s body, they are given the name somatic or body cells. An increase in somatic cell numbers is largely a result of an increase in the number of leucocytes. The concentration of somatic cells serves as an indirect measure of the level of infection in the cow’s mammary gland.
Methods of Evaluating Somatic Cell Counts
Three methods of evaluating somatic cell counts (SCC) are (1) Bulk Tank SCC [BTSCC], (2) Weighted SCC [WTSCC] and (3) Somatic Cell Count Score [SCCS]. The BTSCC is usually based on a single sample of milk from the bulk tank. The WTSCC is calculated on samples from individual cows and is weighted or adjusted based on each cow’s level of milk production. The WTSCC for all milking cows in a herd should approximate the BTSCC. The SCCS is based on a logarithmic conversion of the actual SCC to a linear score as shown in Table 1.
Each integer increase in linear score is associated with a doubling of the actual SCC and a uniform loss of milk of 1.5 pounds per day. For example, the loss in milk production between scores 2 and 3 is estimated at 1.5 lbs/cow/day based on an actual SCC difference of about 50,000 cells. However, the same loss in production between scores 6 and 7 is associated with an actual SCC difference of about 800,000 cells. With the linear SCC, it is obvious that significant improvements in milk production exist even when actual somatic cell counts are relatively low.
Table 1. Relationship Between SCC Scores and Somatic Cell Counts1
| SCC Score | SCC Range | Estimated Daily Milk Loss Per Cow |
| 0 | 0 – 18,000 | 0 |
| 1 | 19,000 – 35,000 | 0 |
| 2 | 36,000 – 71,000 | 0 |
| 3 | 72,000 – 141,000 | 1.5 |
| 4 | 142,000 – 283,000 | 3.0 |
| 5 | 284,000 – 565,000 | 4.5 |
| 6 | 566,000 – 1,130,000 | 6.0 |
| 7 | 1,131,000 – 2,262,000 | 7.5 |
| 8 | 2,263,000 – 4,523,000 | 9.0 |
| 9 | 4,524,000 – 9,999,000 | 10.5 |
| 1Shook, G. and A. Saeman 1983. J. Dairy Sci. 39(12): 22-23. | ||
Tables 2-5 show herd WTSCC, herd SCCS and SCCS for three lactation groups by herd size group within a region. As an example, Mr. Joe Producer has a herd of 125 cows in New York with a WTSCC of 350,000. He refers to the 100-149 herd size group in Table 2. The mean or average WTSCC for 528 herds is 330,000. The WTSCC for his herd is above 304,000 (50th percentile) but below 396,000 (25th percentile), which places his herd in the 50th percentile rank or the bottom half of herds of similar size in this region.
High and Low Somatic Cell Count Scores
Cows with a SCCS of 0-3 are generally considered uninfected while cows with a SCCS of 7-9 are considered infected. Herds should strive to maximize the percentage of cows in the 0-3 category and minimize the percentage in the 7-9 category. Expect first lactation cows to have a lower SCCS with a higher percentage in the 0-3 category compared to older cows.
Tables 6-9 provide the percentage of cows with low (0-3) and high (7-9) scores for three lactation groups within four regions by herd size. These data allow the comparison of individual herds with similar herds in the same region. As an example, Mr. Joe Milker in Georgia has a herd of 225 Holstein cows. He refers to Table 9 and herd size group 150-249 cows. The average or mean percent 0-3 for first lactation cows is 58 percent. Seventy-five percent of his first, 70 percent of his second and 63 percent of his third and greater lactation cows have a score of 0-3. This places the values for his first and second lactation cows between the 75th and 90th percentiles of herds of similar size in the South region. Additionally, his third and later lactation cows are in the 90th percentile.
Somatic Cell Counts and Herd Milk Production
Mammary gland infections are known to reduce milk production. Tables 10-13 show Herd SCCS, Herd WTSCC and the percentage SCCS distribution by level of milk production within region. The data indicate that as rolling herd average milk production increases, herd average SCCS and WTSCC decline. The distribution of SCCS also indicates that a higher percentage of cows are uninfected (0-3) in high producing herds. The low SCC of higher producing herds is one likely factor contributing to the higher production levels. Example: A herd manager with a 23,250 pound herd average in Indiana refers to Table 12. Herds in this region with similar herd averages have an average SCCS of 2.86 and a WTSCC of 276,000. They also average 65 percent in the 0-3 and 6 percent in the 7-9 categories, respectively. A herd manager can compare his/her herd to other herds with similar production to evaluate current management practices.
Trends in Monthly SCCS
Figures 2-5 show trends in Monthly Somatic Cell Count Scores for SCCS, WTSCC, Percent SCCS (0-3) and Percent SCCS (7-9). These figures provide the opportunity to observe monthly trends as well as regional differences for these somatic cell count parameters. Trends are similar for all figures for all regions. All regions had higher SCCS in the months of July, August and September and the lowest values during the winter and spring months (Figure 2). The WTSCC in Figure 3 shows a similar trend. The percent cows with SCCS (0-3) in the four regions was lowest in August and September when SCCS was highest. Figures 4 and 5 illustrate the percent cows with SCCS 0-3 and 7-9, respectively. These figures correspond closely with Figures 2 and 3, with the highest months during the summer. Although the overall trends are similar, values do vary by region.
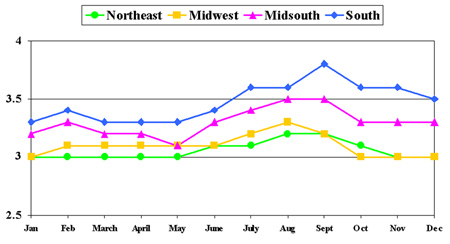 Figure 2. SCCS by Month.
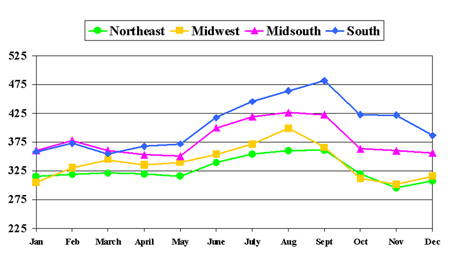 Figure 3. Weighted SCC by Month.
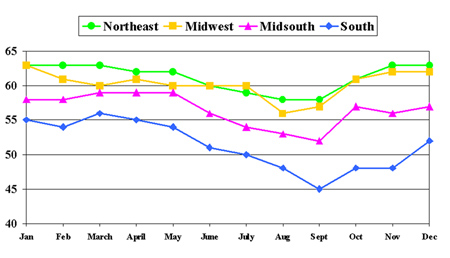 Figure 4. Percent SCCS (0-3).
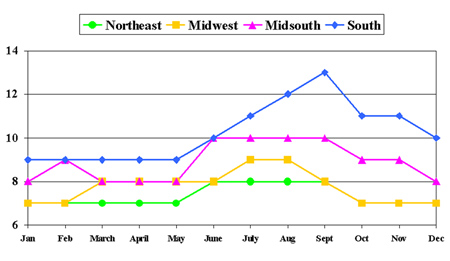 Figure 5. Percent SCCS (7-9).
Monitoring Stage of Lactation SCC
Somatic cell counts vary by age and stage of lactation. Tables 14-17 (beginning on page 24) show SCCS by stage of lactation for three lactation groups (1, 2, 3+) by herd milk production level in four regions. Herd managers can use this data to evaluate the effectiveness of their mastitis control program throughout the lactation. Bill Dairyman in Florida with a 20,231 pound herd average wants to know the expected SCCS for first lactation cows at days 1-40 in milk. He refers to Table 17. First lactation cows with a 20,000-20,999 herd average should have an average SCCS of 3.44.
Conclusion
Udder health must be monitored in order to control and reduce the level of mastitis in a herd. Somatic cell count measurements including SCCS and WTSCC provide the opportunity to monitor and evaluate udder health. By comparing herd somatic cell values to benchmark values, producers can identify problems and set goals for improvement.
References
SAS/STAT® User’s Guide: Statistics, Version 6.12. 1996. SAS Inst., Inc., Cary, NC.
DHI-202 Herd Summary Fact Sheet: A-1. 1997. Dairy Records Management Systems, Raleigh, NC.
Table 2. Herd Weighted Somatic Cell Count (SCC), Herd Somatic Cell County Score (SCCS),and Somatic Cell County Score by Lactation Group in the Northeast Region by Herd Size.
| Northeast – Up to 50 cows | ||||||||
|---|---|---|---|---|---|---|---|---|
| Percentile Rank | ||||||||
| N | Mean | SD | 10th | 25th | 50th | 75th | 90th | |
| Weighted SCC (X 1,000) | 1384 | 326 |
13
|
503 | 407 | 306 | 229 | 171 |
| Herd SCCS | 1384 | 3.1 | 0.6 | 3.8 | 3.5 | 3.0 | 2.6 | 2.3 |
| SCCS (by Lactation) | ||||||||
| 1st | 403 | 2.4 | 0.7 | 3.3 | 2.8 | 2.4 | 1.9 | 1.5 |
| 2nd | 294 | 2.8 | 0.8 | 3.8 | 3.4 | 2.7 | 2.2 | 1.8 |
| 3rd | 799 | 3.4 | 0.8 | 4.6 | 4.0 | 3.4 | 2.8 | 2.4 |
| Northeast – 50 to 99 cows | ||||||||
|---|---|---|---|---|---|---|---|---|
| Percentile Rank | ||||||||
| N | Mean | SD | 10th | 25th | 50th | 75th | 90th | |
| Weighted SCC (X 1,000) | 1888 | 331 | 135 | 514 | 401 | 311 | 237 | 180 |
| Herd SCCS | 1888 | 3.1 | 0.6 | 3.9 | 3.5 | 3.1 | 2.7 | 2.4 |
| SCCS (by Lactation) | ||||||||
| 1st | 1036 | 2.4 | 0.6 | 3.3 | 2.9 | 2.4 | 2.0 | 1.7 |
| 2nd | 967 | 2.8 | 0.8 | 3.9 | 3.3 | 2.8 | 2.3 | 1.9 |
| 3rd | 1473 | 3.5 | 0.8 | 4.5 | 4.0 | 3.5 | 2.9 | 2.5 |
| Northeast – 100 to 149 cows | ||||||||
|---|---|---|---|---|---|---|---|---|
| Percentile Rank | ||||||||
| N | Mean | SD | 10th | 25th | 50th | 75th | 90th | |
| Weighted SCC (X 1,000) | 528 | 330 | 123 | 493 | 396 | 304 | 243 | 194 |
| Herd SCCS | 528 | 3.1 | 0.5 | 3.8 | 3.4 | 3.0 | 2.7 | 2.4 |
| SCCS (by Lactation) | ||||||||
| 1st | 381 | 2.4 | 0.6 | 3.2 | 2.8 | 2.4 | 2.0 | 1.7 |
| 2nd | 393 | 2.8 | 0.6 | 3.7 | 3.2 | 2.7 | 2.3 | 2.0 |
| 3rd | 479 | 3.4 | 0.7 | 4.3 | 3.9 | 3.4 | 3.0 | 2.6 |
| Northeast – 150 to 249 cows | ||||||||
|---|---|---|---|---|---|---|---|---|
| Percentile Rank | ||||||||
| N | Mean | SD | 10th | 25th | 50th | 75th | 90th | |
| Weighted SCC (X 1,000) | 313 | 313 | 114 | 457 | 378 | 291 | 228 | 193 |
| Herd SCCS | 313 | 3.0 | 0.5 | 3.7 | 3.3 | 2.9 | 2.6 | 2.4 |
| SCCS (by Lactation) | ||||||||
| 1st | 274 | 2.4 | 0.5 | 3.1 | 2.6 | 2.3 | 2.0 | 1.8 |
| 2nd | 283 | 2.7 | 0.6 | 3.6 | 3.1 | 2.7 | 2.3 | 2.0 |
| 3rd | 293 | 3.4 | 0.6 | 4.2 | 3.7 | 3.3 | 2.9 | 2.6 |
| Northeast – 250 to 349 cows | ||||||||
|---|---|---|---|---|---|---|---|---|
| Percentile Rank | ||||||||
| N | Mean | SD | 10th | 25th | 50th | 75th | 90th | |
| Weighted SCC (X 1,000) | 125 | 306 | 110 | 418 | 359 | 281 | 228 | 195 |
| Herd SCCS | 125 | 3.0 | 0.4 | 3.5 | 3.2 | 2.9 | 2.6 | 2.4 |
| SCCS (by Lactation) | ||||||||
| 1st | 109 | 2.4 | 0.6 | 3.1 | 2.7 | 2.3 | 2.0 | 1.8 |
| 2nd | 109 | 2.8 | 0.5 | 3.6 | 3.1 | 2.8 | 2.4 | 2.1 |
| 3rd | 109 | 3.4 | 0.6 | 4.2 | 3.8 | 3.4 | 3.1 | 2.7 |
| Northeast – 350+ cows | ||||||||
|---|---|---|---|---|---|---|---|---|
| Percentile Rank | ||||||||
| N | Mean | SD | 10th | 25th | 50th | 75th | 90th | |
| Weighted SCC (X 1,000) | 161 | 271 | 84 | 359 | 309 | 261 | 214 | 183 |
| Herd SCCS | 161 | 2.8 | 0.4 | 3.2 | 3.0 | 2.8 | 2.5 | 2.3 |
| SCCS (by Lactation) | ||||||||
| 1st | 122 | 2.2 | 0.4 | 2.8 | 2.6 | 2.2 | 1.9 | 1.7 |
| 2nd | 123 | 2.7 | 0.5 | 3.5 | 2.9 | 2.6 | 2.3 | 2.1 |
| 3rd | 125 | 3.3 | 0.6 | 4.1 | 3.6 | 3.3 | 2.9 | 2.6 |
Table 3. Herd Weighted Somatic Cell Count (SCC), Herd Somatic Cell Count Score (SCCS), and Somatic Cell Count Score by Lactation Group in the Mid-South Region by Herd Size.
| Mid-South – Up to 50 cows | ||||||||
|---|---|---|---|---|---|---|---|---|
| Percentile Rank | ||||||||
| N | Mean | SD | 10th | 25th | 50th | 75th | 90th | |
| Weighted SCC (X 1,000) | 183 | 370 | 167 | 627 | 463 | 332 | 250 | 186 |
| Herd SCCS | 183 | 3.3 | 0.6 | 4.1 | 3.7 | 3.3 | 2.8 | 2.5 |
| SCCS (by Lactation) | ||||||||
| 1st | 36 | 2.6 | 0.6 | 3.6 | 3.0 | 2.6 | 2.2 | 2.0 |
| 2nd | 46 | 3.0 | 0.9 | 4.1 | 3.8 | 2.8 | 2.4 | 1.9 |
| 3rd | 83 | 3.7 | 0.8 | 4.7 | 4.2 | 3.7 | 3.1 | 2.8 |
| Mid-South – 50 to 99 cows | ||||||||
|---|---|---|---|---|---|---|---|---|
| Percentile Rank | ||||||||
| N | Mean | SD | 10th | 25th | 50th | 75th | 90th | |
| Weighted SCC (X 1,000) | 705 | 375 | 148 | 566 | 452 | 349 | 268 | 210 |
| Herd SCCS | 705 | 3.3 | 0.6 | 4.0 | 3.6 | 3.2 | 2.9 | 2.6 |
| SCCS (by Lactation) | ||||||||
| 1st | 329 | 2.7 | 0.7 | 3.6 | 3.2 | 2.7 | 2.3 | 1.9 |
| 2nd | 359 | 3.0 | 0.8 | 4.0 | 3.5 | 3.0 | 2.5 | 2.1 |
| 3rd | 521 | 3.7 | 0.8 | 4.8 | 4.3 | 3.7 | 3.2 | 2.7 |
| Mid-South – 100 to 149 cows | ||||||||
|---|---|---|---|---|---|---|---|---|
| Percentile Rank | ||||||||
| N | Mean | SD | 10th | 25th | 50th | 75th | 90th | |
| Weighted SCC (X 1,000) | 458 | 372 | 120 | 534 | 436 | 358 | 294 | 228 |
| Herd SCCS | 458 | 3.3 | 0.5 | 3.9 | 3.6 | 3.2 | 2.9 | 2.6 |
| SCCS (by Lactation) | ||||||||
| 1st | 279 | 2.8 | 0.6 | 3.7 | 3.2 | 2.8 | 2.4 | 2.1 |
| 2nd | 329 | 3.0 | 0.7 | 4.0 | 3.4 | 3.0 | 2.6 | 2.2 |
| 3rd | 405 | 3.7 | 0.7 | 4.6 | 4.1 | 3.7 | 3.2 | 2.8 |
| Mid-South – 150 to 249 cows | ||||||||
|---|---|---|---|---|---|---|---|---|
| Percentile Rank | ||||||||
| N | Mean | SD | 10th | 25th | 50th | 75th | 90th | |
| Weighted SCC (X 1,000) | 262 | 382 | 131 | 546 | 446 | 358 | 296 | 237 |
| Herd SCCS | 262 | 3.3 | 0.5 | 4.0 | 3.7 | 3.3 | 3.0 | 2.7 |
| SCCS (by Lactation) | ||||||||
| 1st | 199 | 3.0 | 0.5 | 3.7 | 3.3 | 3.0 | 2.7 | 2.3 |
| 2nd | 225 | 3.2 | 0.6 | 4.0 | 3.6 | 3.1 | 2.4 | 2.5 |
| 3rd | 245 | 3.7 | 0.6 | 4.6 | 4.1 | 3.7 | 3.3 | 3.0 |
| Mid-South – 250+ cows | ||||||||
|---|---|---|---|---|---|---|---|---|
| Percentile Rank | ||||||||
| N | Mean | SD | 10th | 25th | 50th | 75th | 90th | |
| Weighted SCC (X 1,000) | 112 | 386 | 128 | 545 | 484 | 374 | 284 | 228 |
| Herd SCCS | 112 | 3.3 | 0.5 | 3.9 | 3.7 | 3.4 | 3.0 | 2.7 |
| SCCS (by Lactation) | ||||||||
| 1st | 99 | 3.0 | 0.5 | 3.6 | 3.3 | 3.0 | 2.5 | 2.2 |
| 2nd | 106 | 3.2 | 0.6 | 4.1 | 3.6 | 3.3 | 2.8 | 2.5 |
| 3rd | 103 | 3.7 | 0.6 | 4.5 | 4.2 | 3.8 | 3.2 | 3.0 |
Table 4. Herd Weighted Somatic Cell Count (SCC), Herd Somatic Cell Count Score (SCCS), and Somatic Cell Count Score by Lactation Group in the Midwest Region by Herd Size.
| Midwest – Up to 50 cows | ||||||||
|---|---|---|---|---|---|---|---|---|
| Percentile Rank | ||||||||
| N | Mean | SD | 10th | 25th | 50th | 75th | 90th | |
| Weighted SCC (X 1,000) | 112 | 386 | 128 | 545 | 484 | 374 | 284 | 228 |
| Herd SCCS | 112 | 3.3 | 0.5 | 3.9 | 3.7 | 3.4 | 3.0 | 2.7 |
| SCCS (by Lactation) | ||||||||
| 1st | 99 | 3.0 | 0.5 | 3.6 | 3.3 | 3.0 | 2.5 | 2.2 |
| 2nd | 106 | 3.2 | 0.6 | 4.1 | 3.6 | 3.3 | 2.8 | 2.5 |
| 3rd | 103 | 3.7 | 0.6 | 4.5 | 4.2 | 3.8 | 3.2 | 3.0 |
| Midwest – 50 to 99 cows | ||||||||
|---|---|---|---|---|---|---|---|---|
| Percentile Rank | ||||||||
| N | Mean | SD | 10th | 25th | 50th | 75th | 90th | |
| Weighted SCC (X 1,000) | 1707 | 342 | 141 | 530 | 422 | 321 | 239 | 180 |
| Herd SCCS | 1707 | 3.2 | 0.4 | 3.9 | 3.5 | 3.1 | 2.7 | 2.4 |
| SCCS (by Lactation) | ||||||||
| 1st | 979 | 2.6 | 0.7 | 3.5 | 3.1 | 2.6 | 2.2 | 1.8 |
| 2nd | 897 | 2.9 | 0.8 | 3.9 | 3.4 | 2.9 | 2.4 | 1.9 |
| 3rd | 1303 | 3.5 | 0.8 | 4.6 | 4.1 | 3.4 | 2.9 | 2.5 |
| Midwest – 100 to 149 cows | ||||||||
|---|---|---|---|---|---|---|---|---|
| Percentile Rank | ||||||||
| N | Mean | SD | 10th | 25th | 50th | 75th | 90th | |
| Weighted SCC (X 1,000) | 650 | 328 | 140 | 500 | 392 | 312 | 231 | 168 |
| Herd SCCS | 650 | 3.0 | 0.6 | 3.8 | 3.4 | 3.0 | 2.7 | 2.3 |
| SCCS (by Lactation) | ||||||||
| 1st | 468 | 2.6 | 0.6 | 3.5 | 3.0 | 2.6 | 2.2 | 1.8 |
| 2nd | 516 | 2.9 | 0.7 | 3.9 | 3.4 | 2.9 | 2.4 | 1.9 |
| 3rd | 584 | 3.4 | 0.8 | 4.4 | 4.0 | 3.4 | 3.0 | 2.4 |
| Midwest – 150 to 249 cows | ||||||||
|---|---|---|---|---|---|---|---|---|
| Percentile Rank | ||||||||
| N | Mean | SD | 10th | 25th | 50th | 75th | 90th | |
| Weighted SCC (X 1,000) | 356 | 314 | 123 | 483 | 386 | 294 | 224 | 176 |
| Herd SCCS | 356 | 3.0 | 0.5 | 3.7 | 3.3 | 3.0 | 2.6 | 2.3 |
| SCCS (by Lactation) | ||||||||
| 1st | 308 | 2.5 | 0.6 | 3.3 | 2.9 | 2.5 | 2.2 | 1.8 |
| 2nd | 326 | 2.8 | 0.7 | 3.7 | 3.3 | 2.8 | 2.3 | 1.9 |
| 3rd | 336 | 3.4 | 0.7 | 4.3 | 3.8 | 3.4 | 3.0 | 2.5 |
| Midwest – 250+ cows | ||||||||
|---|---|---|---|---|---|---|---|---|
| Percentile Rank | ||||||||
| N | Mean | SD | 10th | 25th | 50th | 75th | 90th | |
| Weighted SCC (X 1,000) | 217 | 296 | 112 | 433 | 358 | 280 | 211 | 168 |
| Herd SCCS | 217 | 2.9 | 0.5 | 3.5 | 3.3 | 2.9 | 2.5 | 2.3 |
| SCCS (by Lactation) | ||||||||
| 1st | 198 | 2.6 | 0.5 | 3.3 | 2.9 | 2.5 | 2.2 | 2.0 |
| 2nd | 201 | 2.9 | 0.6 | 3.6 | 3.3 | 2.8 | 2.5 | 2.1 |
| 3rd | 199 | 3.3 | 0.6 | 4.1 | 3.7 | 3.3 | 3.0 | 2.6 |
Table 5. Herd Weighted Somatic Cell Count (SCC), Herd Somatic Cell Count Score (SCCS), and Somatic Cell Count Score by Lactation Group in the South Region by Herd Size.
| South – Up to 100 cows | ||||||||
|---|---|---|---|---|---|---|---|---|
| Percentile Rank | ||||||||
| N | Mean | SD | 10th | 25th | 50th | 75th | 90th | |
| Weighted SCC (X 1,000) | 115 | 396 | 133 | 605 | 468 | 383 | 305 | 240 |
| Herd SCCS | 115 | 3.4 | 0.6 | 4.1 | 3.8 | 3.4 | 3.0 | 2.7 |
| SCCS (by Lactation) | ||||||||
| 1st | 39 | 2.9 | 0.8 | 4.0 | 3.5 | 2.9 | 2.3 | 1.7 |
| 2nd | 50 | 3.2 | 0.7 | 4.0 | 3.6 | 3.2 | 2.6 | 2.2 |
| 3rd | 75 | 3.9 | 0.8 | 4.8 | 4.5 | 4.0 | 3.3 | 2.9 |
| South – 100 to 149 cows | ||||||||
|---|---|---|---|---|---|---|---|---|
| Percentile Rank | ||||||||
| N | Mean | SD | 10th | 25th | 50th | 75th | 90th | |
| Weighted SCC (X 1,000) | 136 | 416 | 157 | 609 | 463 | 387 | 316 | 253 |
| Herd SCCS | 136 | 3.5 | 0.5 | 4.3 | 3.8 | 3.5 | 3.2 | 2.9 |
| SCCS (by Lactation) | ||||||||
| 1st | 73 | 3.0 | 0.6 | 3.7 | 3.3 | 3.0 | 2.6 | 2.3 |
| 2nd | 86 | 3.3 | 0.8 | 4.3 | 3.9 | 3.3 | 2.7 | 2.4 |
| 3rd | 104 | 4.0 | 0.7 | 4.9 | 4.4 | 4.0 | 3.5 | 3.0 |
| South – 150 to 249 cows | ||||||||
|---|---|---|---|---|---|---|---|---|
| Percentile Rank | ||||||||
| N | Mean | SD | 10th | 25th | 50th | 75th | 90th | |
| Weighted SCC (X 1,000) | 157 | 406 | 139 | 579 | 494 | 396 | 299 | 250 |
| Herd SCCS | 157 | 3.5 | 0.6 | 4.2 | 3.9 | 3.5 | 3.1 | 2.8 |
| SCCS (by Lactation) | ||||||||
| 1st | 116 | 3.1 | 0.6 | 4.0 | 3.6 | 3.1 | 2.7 | 2.3 |
| 2nd | 120 | 3.4 | 0.7 | 4.3 | 3.8 | 3.3 | 2.8 | 2.6 |
| 3rd | 127 | 4.0 | 0.6 | 4.9 | 4.3 | 4.0 | 3.6 | 3.1 |
| South – 250 to 499 cows | ||||||||
|---|---|---|---|---|---|---|---|---|
| Percentile Rank | ||||||||
| N | Mean | SD | 10th | 25th | 50th | 75th | 90th | |
| Weighted SCC (X 1,000) | 110 | 409 | 166 | 602 | 509 | 373 | 290 | 232 |
| Herd SCCS | 110 | 3.5 | 0.6 | 4.2 | 3.9 | 3.4 | 3.1 | 2.8 |
| SCCS (by Lactation) | ||||||||
| 1st | 93 | 3.3 | 0.6 | 4.2 | 3.5 | 3.3 | 3.0 | 2.6 |
| 2nd | 96 | 3.5 | 0.7 | 4.3 | 4.0 | 3.4 | 3.0 | 2.7 |
| 3rd | 95 | 4.0 | 0.7 | 4.8 | 4.5 | 4.0 | 3.6 | 3.2 |
| South – 500+ cows | ||||||||
|---|---|---|---|---|---|---|---|---|
| Percentile Rank | ||||||||
| N | Mean | SD | 10th | 25th | 50th | 75th | 90th | |
| Weighted SCC (X 1,000) | 69 | 376 | 139 | 542 | 459 | 357 | 275 | 227 |
| Herd SCCS | 69 | 3.3 | 0.5 | 3.8 | 3.7 | 3.4 | 2.9 | 2.7 |
| SCCS (by Lactation) | ||||||||
| 1st | 58 | 3.0 | 0.6 | 3.8 | 3.4 | 3.0 | 2.7 | 2.2 |
| 2nd | 58 | 3.3 | 0.5 | 4.1 | 3.6 | 3.3 | 3.0 | 2.7 |
| 3rd | 55 | 3.8 | 0.5 | 4.5 | 4.1 | 3.8 | 3.6 | 3.2 |
Table 6. Percent Cows with Low (0-3) and High (7-9) Somatic Cell Count Scores by Lactation Group for the Northeast Region by Herd Size.
| Northeast – Up to 50 cows | |||||||||
|---|---|---|---|---|---|---|---|---|---|
| Percentile Rank | |||||||||
| N | Mean | SD | 10th | 25th | 50th | 75th | 90th | ||
| % 0-3 | Lact 1 | 1361 | 74 | 18 | 50 | 63 | 75 | 88 | 100 |
| Lact 2 | 1361 | 64 | 22 | 33 | 50 | 67 | 80 | 90 | |
| Lact 3+ | 1364 | 53 | 18 | 29 | 40 | 53 | 67 | 75 | |
| All | 1367 | 62 | 14 | 43 | 53 | 63 | 72 | 79 | |
| % 7-9 | Lact 1 | 1361 | 4 | 7 | 13 | 7 | 0 | 0 | 0 |
| Lact 2 | 1364 | 6 | 10 | 17 | 10 | 0 | 0 | 0 | |
| Lact 3+ | 1364 | 10 | 10 | 23 | 15 | 8 | 0 | 0 | |
| All | 1367 | 7 | 6 | 15 | 10 | 6 | 3 | 0 | |
| Northeast – 50 to 99 cows | |||||||||
|---|---|---|---|---|---|---|---|---|---|
| Percentile Rank | |||||||||
| N | Mean | SD | 10th | 25th | 50th | 75th | 90th | ||
| % 0-3 | Lact 1 | 1842 | 75 | 15 | 56 | 67 | 77 | 86 | 92 |
| Lact 2 | 1844 | 66 | 18 | 42 | 55 | 68 | 79 | 88 | |
| Lact 3+ | 1845 | 52 | 16 | 30 | 41 | 53 | 64 | 74 | |
| All | 1846 | 63 | 13 | 46 | 55 | 65 | 73 | 79 | |
| % 7-9 | Lact 1 | 1842 | 4 | 5 | 11 | 6 | 0 | 0 | 0 |
| Lact 2 | 1844 | 5 | 7 | 14 | 9 | 0 | 0 | 0 | |
| Lact 3+ | 1845 | 11 | 8 | 22 | 15 | 10 | 5 | 0 | |
| All | 1846 | 7 | 5 | 14 | 10 | 6 | 4 | 2 | |
| Northeast – 100 to 149 cows | |||||||||
|---|---|---|---|---|---|---|---|---|---|
| Percentile Rank | |||||||||
| N | Mean | SD | 10th | 25th | 50th | 75th | 90th | ||
| % 0-3 | Lact 1 | 499 | 76 | 12 | 60 | 69 | 77 | 85 | 90 |
| Lact 2 | 499 | 67 | 14 | 48 | 58 | 69 | 77 | 84 | |
| Lact 3+ | 499 | 54 | 14 | 35 | 45 | 55 | 64 | 71 | |
| All | 499 | 65 | 11 | 50 | 58 | 66 | 73 | 75 | |
| % 7-9 | Lact 1 | 499 | 4 | 4 | 9 | 6 | 3 | 0 | 0 |
| Lact 2 | 499 | 6 | 6 | 14 | 8 | 4 | 0 | 0 | |
| Lact 3+ | 499 | 10 | 7 | 19 | 14 | 9 | 5 | 2 | |
| All | 499 | 7 | 4 | 13 | 9 | 6 | 4 | 2 | |
| Northeast – 150 to 249 cows | |||||||||
|---|---|---|---|---|---|---|---|---|---|
| Percentile Rank | |||||||||
| N | Mean | SD | 10th | 25th | 50th | 75th | 90th | ||
| % 0-3 | Lact 1 | 298 | 76 | 11 | 59 | 71 | 78 | 84 | 88 |
| Lact 2 | 298 | 68 | 12 | 51 | 61 | 70 | 77 | 83 | |
| Lact 3+ | 298 | 56 | 12 | 39 | 49 | 57 | 64 | 70 | |
| All | 298 | 67 | 10 | 53 | 61 | 68 | 74 | 78 | |
| % 7-9 | Lact 1 | 298 | 4 | 3 | 8 | 5 | 3 | 2 | 0 |
| Lact 2 | 298 | 5 | 5 | 12 | 8 | 4 | 2 | 0 | |
| Lact 3+ | 298 | 10 | 6 | 19 | 14 | 9 | 6 | 3 | |
| All | 298 | 6 | 4 | 11 | 8 | 6 | 4 | 2 | |
| Northeast – 250 to 349 cows | |||||||||
|---|---|---|---|---|---|---|---|---|---|
| Percentile Rank | |||||||||
| N | Mean | SD | 10th | 25th | 50th | 75th | 90th | ||
| % 0-3 | Lact 1 | 110 | 77 | 10 | 62 | 71 | 79 | 85 | 88 |
| Lact 2 | 110 | 67 | 11 | 50 | 61 | 68 | 76 | 82 | |
| Lact 3+ | 110 | 54 | 11 | 39 | 47 | 54 | 62 | 67 | |
| All | 110 | 67 | 10 | 55 | 61 | 68 | 74 | 78 | |
| % 7-9 | Lact 1 | 110 | 4 | 3 | 8 | 5 | 3 | 1 | 1 |
| Lact 2 | 110 | 5 | 4 | 11 | 7 | 5 | 3 | 1 | |
| Lact 3+ | 110 | 11 | 6 | 18 | 14 | 10 | 7 | 4 | |
| All | 110 | 6 | 3 | 11 | 8 | 6 | 4 | 2 | |
| Northeast – 350+ cows | |||||||||
|---|---|---|---|---|---|---|---|---|---|
| Percentile Rank | |||||||||
| N | Mean | SD | 10th | 25th | 50th | 75th | 90th | ||
| % 0-3 | Lact 1 | 123 | 78 | 9 | 69 | 74 | 80 | 84 | 88 |
| Lact 2 | 123 | 69 | 10 | 55 | 65 | 70 | 75 | 82 | |
| Lact 3+ | 123 | 56 | 10 | 42 | 49 | 56 | 63 | 69 | |
| All | 123 | 69 | 8 | 59 | 64 | 69 | 75 | 79 | |
| % 7-9 | Lact 1 | 123 | 3 | 2 | 6 | 4 | 3 | 2 | 1 |
| Lact 2 | 123 | 5 | 3 | 9 | 7 | 4 | 3 | 1 | |
| Lact 3+ | 123 | 9 | 5 | 15 | 12 | 9 | 6 | 4 | |
| All | 123 | 6 | 3 | 9 | 6 | 5 | 4 | 3 | |
Table 7. Percent Cows with Low (0-3) and High (7-9) Somatic Cell Count Scores by Lactation Group for the Mid-South Region by Herd Size.
| Mid-South – Up to 50 cows | |||||||||
|---|---|---|---|---|---|---|---|---|---|
| Percentile Rank | |||||||||
| N | Mean | SD | 10th | 25th | 50th | 75th | 90th | ||
| % 0-3 | Lact 1 | 178 | 67 | 20 | 43 | 56 | 69 | 82 | 90 |
| Lact 2 | 182 | 60 | 25 | 25 | 43 | 63 | 75 | 100 | |
| Lact 3+ | 182 | 47 | 20 | 22 | 33 | 47 | 60 | 71 | |
| All | 183 | 56 | 16 | 37 | 45 | 56 | 67 | 77 | |
| % 7-9 | Lact 1 | 178 | 4 | 8 | 13 | 7 | 0 | 0 | 0 |
| Lact 2 | 182 | 7 | 12 | 25 | 11 | 0 | 0 | 0 | |
| Lact 3+ | 182 | 11 | 11 | 25 | 17 | 10 | 0 | 0 | |
| All | 183 | 8 | 8 | 17 | 12 | 7 | 3 | 0 | |
| Mid-South – 50 to 99 cows | |||||||||
|---|---|---|---|---|---|---|---|---|---|
| Percentile Rank | |||||||||
| N | Mean | SD | 10th | 25th | 50th | 75th | 90th | ||
| % 0-3 | Lact 1 | 684 | 68 | 17 | 45 | 58 | 70 | 79 | 87 |
| Lact 2 | 688 | 62 | 19 | 36 | 50 | 64 | 75 | 86 | |
| Lact 3+ | 686 | 47 | 17 | 24 | 36 | 46 | 59 | 69 | |
| All | 688 | 57 | 14 | 38 | 49 | 58 | 68 | 74 | |
| % 7-9 | Lact 1 | 684 | 4 | 6 | 11 | 7 | 3 | 0 | 0 |
| Lact 2 | 688 | 6 | 8 | 16 | 10 | 5 | 0 | 0 | |
| Lact 3+ | 686 | 13 | 10 | 25 | 18 | 11 | 6 | 0 | |
| All | 688 | 8 | 6 | 16 | 11 | 7 | 4 | 2 | |
| Mid-South – 100 to 149 cows | |||||||||
|---|---|---|---|---|---|---|---|---|---|
| Percentile Rank | |||||||||
| N | Mean | SD | 10th | 25th | 50th | 75th | 90th | ||
| % 0-3 | Lact 1 | 447 | 66 | 14 | 48 | 57 | 67 | 76 | 83 |
| Lact 2 | 447 | 61 | 15 | 41 | 52 | 61 | 72 | 80 | |
| Lact 3+ | 447 | 49 | 14 | 30 | 39 | 48 | 60 | 68 | |
| All | 447 | 58 | 12 | 42 | 50 | 58 | 66 | 73 | |
| % 7-9 | Lact 1 | 447 | 5 | 5 | 11 | 8 | 4 | 0 | 0 |
| Lact 2 | 447 | 6 | 6 | 14 | 10 | 5 | 0 | 0 | |
| Lact 3+ | 447 | 12 | 8 | 23 | 16 | 11 | 6 | 3 | |
| All | 447 | 8 | 5 | 14 | 11 | 7 | 5 | 3 | |
| Mid-South – 150 to 249 cows | |||||||||
|---|---|---|---|---|---|---|---|---|---|
| Percentile Rank | |||||||||
| N | Mean | SD | 10th | 25th | 50th | 75th | 90th | ||
| % 0-3 | Lact 1 | 253 | 64 | 12 | 47 | 56 | 64 | 72 | 79 |
| Lact 2 | 253 | 59 | 14 | 41 | 51 | 60 | 69 | 76 | |
| Lact 3+ | 253 | 48 | 13 | 30 | 39 | 48 | 57 | 63 | |
| All | 253 | 56 | 11 | 43 | 50 | 57 | 64 | 69 | |
| % 7-9 | Lact 1 | 253 | 6 | 0.5 | 12 | 8 | 5 | 2 | 0 |
| Lact 2 | 253 | 7 | 0.6 | 14 | 10 | 6 | 3 | 0 | |
| Lact 3+ | 253 | 7 | 0.7 | 22 | 17 | 12 | 7 | 4 | |
| All | 253 | 9 | 0.5 | 15 | 11 | 8 | 5 | 4 | |
| Mid-South – 250+ cows | |||||||||
|---|---|---|---|---|---|---|---|---|---|
| Percentile Rank | |||||||||
| N | Mean | SD | 10th | 25th | 50th | 75th | 90th | ||
| % 0-3 | Lact 1 | 106 | 64 | 12 | 50 | 56 | 64 | 74 | 80 |
| Lact 2 | 106 | 58 | 12 | 43 | 51 | 58 | 68 | 75 | |
| Lact 3+ | 106 | 48 | 11 | 34 | 41 | 48 | 56 | 63 | |
| All | 106 | 57 | 10 | 44 | 51 | 56 | 65 | 72 | |
| % 7-9 | Lact 1 | 106 | 6 | 4 | 10 | 8 | 6 | 4 | 2 |
| Lact 2 | 106 | 8 | 5 | 16 | 11 | 8 | 4 | 2 | |
| Lact 3+ | 106 | 13 | 6 | 21 | 17 | 12 | 8 | 5 | |
| All | 106 | 9 | 4 | 14 | 12 | 8 | 6 | 4 | |
Table 8. Percent Cows with Low (0-3) and High (7-9) Somatic Cell County Scores by Lactation Group for the Midwest Region by Herd Size.
| Midwest – Up to 50 cows | |||||||||
|---|---|---|---|---|---|---|---|---|---|
| Percentile Rank | |||||||||
| N | Mean | SD | 10th | 25th | 50th | 75th | 90th | ||
| % 0-3 | Lact 1 | 766 | 70 | 20 | 45 | 57 | 71 | 85 | 93 |
| Lact 2 | 768 | 64 | 23 | 33 | 50 | 67 | 80 | 91 | |
| Lact 3+ | 769 | 51 | 20 | 25 | 38 | 50 | 67 | 78 | |
| All | 770 | 61 | 15 | 40 | 51 | 62 | 71 | 80 | |
| % 7-9 | Lact 1 | 766 | 4 | 7 | 13 | 7 | 0 | 0 | 0 |
| Lact 2 | 768 | 5 | 9 | 17 | 9 | 0 | 0 | 0 | |
| Lact 3+ | 769 | 10 | 11 | 25 | 18 | 8 | 0 | 0 | |
| All | 770 | 7 | 6 | 16 | 10 | 6 | 3 | 0 | |
| Midwest – 50 to 99 cows | |||||||||
|---|---|---|---|---|---|---|---|---|---|
| Percentile Rank | |||||||||
| N | Mean | SD | 10th | 25th | 50th | 75th | 90th | ||
| % 0-3 | Lact 1 | 1686 | 71 | 15 | 50 | 61 | 72 | 82 | 89 |
| Lact 2 | 1687 | 64 | 18 | 41 | 53 | 67 | 77 | 87 | |
| Lact 3+ | 1684 | 52 | 17 | 29 | 40 | 53 | 64 | 73 | |
| All | 1688 | 62 | 13 | 44 | 53 | 63 | 72 | 78 | |
| % 7-9 | Lact 1 | 1686 | 5 | 6 | 13 | 7 | 3 | 0 | 0 |
| Lact 2 | 1687 | 6 | 7 | 15 | 9 | 4 | 0 | 0 | |
| Lact 3+ | 1684 | 10 | 9 | 22 | 15 | 9 | 4 | 0 | |
| All | 1688 | 7 | 5 | 14 | 10 | 6 | 3 | 2 | |
| Midwest – 100 to 149 cows | |||||||||
|---|---|---|---|---|---|---|---|---|---|
| Percentile Rank | |||||||||
| N | Mean | SD | 10th | 25th | 50th | 75th | 90th | ||
| % 0-3 | Lact 1 | 636 | 71 | 14 | 53 | 63 | 71 | 80 | 87 |
| Lact 2 | 637 | 64 | 16 | 44 | 53 | 65 | 75 | 83 | |
| Lact 3+ | 636 | 53 | 15 | 33 | 43 | 53 | 63 | 73 | |
| All | 637 | 62 | 12 | 46 | 55 | 63 | 71 | 78 | |
| % 7-9 | Lact 1 | 636 | 4 | 4 | 10 | 6 | 3 | 0 | 0 |
| Lact 2 | 637 | 6 | 6 | 14 | 9 | 4 | 0 | 0 | |
| Lact 3+ | 636 | 10 | 8 | 20 | 14 | 9 | 4 | 2 | |
| All | 637 | 7 | 5 | 13 | 9 | 6 | 4 | 2 | |
| Midwest – 150 to 249 cows | |||||||||
|---|---|---|---|---|---|---|---|---|---|
| Percentile Rank | |||||||||
| N | Mean | SD | 10th | 25th | 50th | 75th | 90th | ||
| % 0-3 | Lact 1 | 344 | 71 | 12 | 56 | 65 | 73 | 79 | 87 |
| Lact 2 | 344 | 65 | 14 | 47 | 56 | 66 | 75 | 81 | |
| Lact 3+ | 344 | 53 | 14 | 35 | 44 | 54 | 63 | 70 | |
| All | 344 | 63 | 12 | 48 | 57 | 64 | 71 | 77 | |
| % 7-9 | Lact 1 | 344 | 4 | 4 | 9 | 6 | 3 | 2 | 0 |
| Lact 2 | 344 | 6 | 5 | 13 | 8 | 4 | 2 | 0 | |
| Lact 3+ | 344 | 10 | 6 | 19 | 14 | 9 | 5 | 3 | |
| All | 344 | 6 | 4 | 12 | 9 | 6 | 4 | 2 | |
| Midwest – 250+ cows | |||||||||
|---|---|---|---|---|---|---|---|---|---|
| Percentile Rank | |||||||||
| N | Mean | SD | 10th | 25th | 50th | 75th | 90th | ||
| % 0-3 | Lact 1 | 204 | 72 | 9 | 58 | 66 | 72 | 78 | 83 |
| Lact 2 | 204 | 64 | 12 | 49 | 55 | 66 | 73 | 79 | |
| Lact 3+ | 204 | 55 | 12 | 39 | 47 | 56 | 62 | 69 | |
| All | 204 | 64 | 9 | 51 | 58 | 65 | 71 | 77 | |
| % 7-9 | Lact 1 | 204 | 4 | 3 | 8 | 5 | 4 | 2 | 1 |
| Lact 2 | 204 | 6 | 4 | 10 | 7 | 5 | 3 | 1 | |
| Lact 3+ | 204 | 9 | 5 | 17 | 12 | 8 | 6 | 3 | |
| All | 204 | 6 | 3 | 10 | 8 | 6 | 4 | 2 | |
Table 9. Percent Cows with Low (0-3) and High (7-9) Somatic Cell Count Scores by Lactation Group for the South Region by Herd Size.
| South – Up to 100 cows | |||||||||
|---|---|---|---|---|---|---|---|---|---|
| Percentile Rank | |||||||||
| N | Mean | SD | 10th | 25th | 50th | 75th | 90th | ||
| % 0-3 | Lact 1 | 106 | 59 | 18 | 32 | 48 | 60 | 72 | 82 |
| Lact 2 | 105 | 56 | 20 | 27 | 43 | 59 | 69 | 82 | |
| Lact 3+ | 106 | 42 | 17 | 22 | 30 | 40 | 52 | 63 | |
| All | 106 | 52 | 15 | 33 | 40 | 52 | 62 | 72 | |
| % 7-9 | Lact 1 | 106 | 6 | 7 | 15 | 9 | 4 | 0 | 0 |
| Lact 2 | 105 | 7 | 8 | 17 | 10 | 5 | 0 | 0 | |
| Lact 3+ | 106 | 15 | 9 | 25 | 19 | 13 | 8 | 5 | |
| All | 106 | 10 | 5 | 16 | 13 | 9 | 6 | 3 | |
| South – 100 to 149 cows | |||||||||
|---|---|---|---|---|---|---|---|---|---|
| Percentile Rank | |||||||||
| N | Mean | SD | 10th | 25th | 50th | 75th | 90th | ||
| % 0-3 | Lact 1 | 120 | 59 | 16 | 40 | 50 | 60 | 70 | 78 |
| Lact 2 | 121 | 54 | 18 | 29 | 41 | 55 | 67 | 75 | |
| Lact 3+ | 121 | 42 | 16 | 19 | 32 | 42 | 52 | 61 | |
| All | 121 | 50 | 15 | 33 | 43 | 51 | 59 | 68 | |
| % 7-9 | Lact 1 | 120 | 6 | 5 | 12 | 8 | 4 | 2 | 0 |
| Lact 2 | 121 | 8 | 7 | 18 | 11 | 7 | 0 | 0 | |
| Lact 3+ | 121 | 15 | 9 | 25 | 20 | 14 | 7 | 4 | |
| All | 121 | 10 | 6 | 17 | 13 | 10 | 6 | 3 | |
| South – 150 to 249 cows | |||||||||
|---|---|---|---|---|---|---|---|---|---|
| Percentile Rank | |||||||||
| N | Mean | SD | 10th | 25th | 50th | 75th | 90th | ||
| % 0-3 | Lact 1 | 138 | 58 | 15 | 39 | 48 | 61 | 68 | 76 |
| Lact 2 | 138 | 55 | 15 | 34 | 45 | 57 | 65 | 73 | |
| Lact 3+ | 138 | 42 | 12 | 24 | 36 | 42 | 50 | 61 | |
| All | 138 | 51 | 12 | 34 | 44 | 53 | 60 | 66 | |
| % 7-9 | Lact 1 | 138 | 6 | 5 | 13 | 9 | 6 | 3 | 2 |
| Lact 2 | 138 | 8 | 6 | 16 | 13 | 8 | 4 | 0 | |
| Lact 3+ | 138 | 15 | 8 | 27 | 19 | 14 | 9 | 6 | |
| All | 138 | 10 | 5 | 17 | 13 | 9 | 7 | 5 | |
| South – 250 to 499 cows | |||||||||
|---|---|---|---|---|---|---|---|---|---|
| Percentile Rank | |||||||||
| N | Mean | SD | 10th | 25th | 50th | 75th | 90th | ||
| % 0-3 | Lact 1 | 99 | 55 | 14 | 33 | 48 | 57 | 65 | 71 |
| Lact 2 | 99 | 51 | 15 | 32 | 43 | 53 | 62 | 71 | |
| Lact 3+ | 99 | 41 | 13 | 26 | 33 | 41 | 49 | 57 | |
| All | 99 | 50 | 13 | 32 | 42 | 51 | 58 | 68 | |
| % 7-9 | Lact 1 | 99 | 8 | 5 | 16 | 10 | 6 | 4 | 3 |
| Lact 2 | 99 | 9 | 6 | 17 | 13 | 8 | 5 | 2 | |
| Lact 3+ | 99 | 16 | 8 | 27 | 20 | 15 | 9 | 6 | |
| All | 99 | 11 | 6 | 20 | 14 | 10 | 7 | 5 | |
| South – 500+ cows | |||||||||
|---|---|---|---|---|---|---|---|---|---|
| Percentile Rank | |||||||||
| N | Mean | SD | 10th | 25th | 50th | 75th | 90th | ||
| % 0-3 | Lact 1 | 58 | 62 | 11 | 46 | 54 | 61 | 71 | 75 |
| Lact 2 | 58 | 55 | 10 | 41 | 47 | 56 | 62 | 70 | |
| Lact 3+ | 58 | 46 | 11 | 32 | 40 | 43 | 51 | 60 | |
| All | 58 | 55 | 10 | 41 | 48 | 55 | 62 | 67 | |
| % 7-9 | Lact 1 | 58 | 7 | 4 | 13 | 10 | 6 | 4 | 2 |
| Lact 2 | 58 | 9 | 4 | 15 | 12 | 8 | 5 | 4 | |
| Lact 3+ | 58 | 14 | 6 | 23 | 16 | 13 | 10 | 8 | |
| All | 58 | 10 | 4 | 16 | 12 | 9 | 7 | 5 | |
Table 10. Percent of Cows with SCCS of 0-3, 4, 5, 6 and 7-9, Herd SCCS, and Weighted SCC for Herds in the Northeast Region by Production Level.
| Northeast | ||||||||
|---|---|---|---|---|---|---|---|---|
| Herd Avg (lbs) | N | 0-3% | 4% | 5% | 6% | 7-9% | Herd SCCS | Weighted SCC (x 1,000) |
| 14000-14999 | 68 | 49 | 17 | 13 | 9 | 11 | 3.74 | 466 |
| 15000-15999 | 128 | 52 | 17 | 12 | 8 | 10 | 3.54 | 413 |
| 16000-16999 | 200 | 56 | 16 | 11 | 8 | 9 | 3.35 | 382 |
| 17000-17999 | 333 | 57 | 16 | 11 | 7 | 8 | 3.28 | 366 |
| 18000-18999 | 426 | 60 | 14 | 10 | 7 | 8 | 3.13 | 336 |
| 19000-19999 | 547 | 59 | 14 | 10 | 7 | 8 | 3.17 | 349 |
| 20000-20999 | 570 | 62 | 14 | 9 | 6 | 7 | 3.00 | 314 |
| 21000-21999 | 616 | 63 | 14 | 9 | 6 | 7 | 2.97 | 306 |
| 22000-22999 | 458 | 63 | 14 | 9 | 6 | 7 | 2.94 | 304 |
| 23000-23999 | 373 | 65 | 14 | 9 | 6 | 6 | 2.83 | 277 |
| 24000-24999 | 260 | 65 | 13 | 8 | 6 | 7 | 2.86 | 294 |
| 25000-25999 | 158 | 69 | 12 | 8 | 5 | 6 | 2.72 | 259 |
| 26000-26999 | 94 | 66 | 13 | 9 | 6 | 6 | 2.77 | 272 |
| 27000+ | 96 | 66 | 12 | 8 | 5 | 6 | 2.79 | 279 |
Table 11. Percent of Cows with SCCS of 0-3, 4, 5, 6 and 7-9, Herd SCCS, and Weighted SCC for Herds in the Mid-South Region by Production Level.
| Mid-South | ||||||||
|---|---|---|---|---|---|---|---|---|
| Herd Avg (lbs) | N | 0-3% | 4% | 5% | 6% | 7-9% | Herd SCCS | Weighted SCC (x 1,000) |
| 14000-14999 | 85 | 49 | 17 | 13 | 9 | 11 | 3.67 | 473 |
| 15000-15999 | 117 | 53 | 16 | 12 | 8 | 10 | 3.48 | 422 |
| 16000-16999 | 158 | 56 | 16 | 12 | 8 | 9 | 3.34 | 388 |
| 17000-17999 | 169 | 55 | 16 | 12 | 8 | 10 | 3.40 | 415 |
| 18000-18999 | 220 | 57 | 15 | 11 | 7 | 9 | 3.26 | 374 |
| 19000-19999 | 213 | 58 | 15 | 11 | 7 | 9 | 3.25 | 366 |
| 20000-20999 | 198 | 59 | 15 | 10 | 7 | 8 | 3.22 | 335 |
| 21000-22999 | 197 | 60 | 15 | 10 | 7 | 8 | 3.13 | 332 |
| 22000-22999 | 128 | 63 | 14 | 10 | 6 | 7 | 3.04 | 309 |
| 23000-23999 | 59 | 63 | 14 | 10 | 6 | 7 | 3.00 | 302 |
| 24000+ | 96 | 61 | 14 | 10 | 7 | 8 | 3.09 | 331 |
Table 12. Percent of Cows with SCCS of 0-3, 4, 5, 6 and 7-9, Herd SCCS, and Weighted SCC for Herds in the Midwest Region by Production Level.
| Midwest | ||||||||
|---|---|---|---|---|---|---|---|---|
| Herd Avg (lbs) | N | 0-3% | 4% | 5% | 6% | 7-9% | Herd SCCS | Weighted SCC (x 1,000) |
| 14000-14999 | 81 | 53 | 16 | 12 | 8 | 10 | 3.50 | 440 |
| 15000-15999 | 153 | 55 | 16 | 11 | 8 | 10 | 3.41 | 416 |
| 16000-16999 | 268 | 55 | 16 | 12 | 8 | 10 | 4.05 | 406 |
| 17000-17999 | 316 | 58 | 15 | 11 | 7 | 8.6 | 3.25 | 370 |
| 18000-18999 | 378 | 59 | 15 | 11 | 7 | 8 | 3.19 | 356 |
| 19000-19999 | 444 | 60 | 15 | 10 | 7 | 8 | 3.16 | 345 |
| 20000-20999 | 483 | 61 | 15 | 10 | 6 | 7 | 3.05 | 323 |
| 21000-21999 | 413 | 62 | 15 | 10 | 6 | 7 | 3.02 | 310 |
| 22000-22999 | 362 | 63 | 14 | 9 | 6 | 7 | 2.96 | 302 |
| 23000-23999 | 264 | 65 | 14 | 9 | 6 | 6 | 2.86 | 276 |
| 24000-24999 | 184 | 66 | 14 | 9 | 6 | 6 | 2.80 | 267 |
| 25000-25999 | 117 | 66 | 14 | 8 | 6 | 6 | 2.79 | 275 |
| 26000-26999 | 76 | 67 | 14 | 8 | 5 | 5 | 2.68 | 242 |
| 27000+ | 91 | 67 | 13 | 8 | 6 | 6 | 2.70 | 253 |
Table 13. Percent of Cows with SCCS of 0-3, 4, 5, 6 and 7-9, Herd SCCS, and Weighted SCC for Herds in the South Region by Production Level.
| South | ||||||||
|---|---|---|---|---|---|---|---|---|
| Herd Avg (lbs) | N | 0-3% | 4% | 5% | 6% | 7-9% | Herd SCCS | Weighted SCC (x 1,000) |
| 14000-14999 | 45 | 48 | 17 | 13 | 10 | 12 | 3.70 | 464 |
| 15000-15999 | 52 | 48 | 17 | 14 | 10 | 11 | 3.62 | 430 |
| 16000-16999 | 49 | 49 | 17 | 13 | 9 | 12 | 3.60 | 447 |
| 17000-17999 | 67 | 50 | 17 | 13 | 9 | 11 | 3.56 | 419 |
| 18000-18999 | 66 | 52 | 16 | 13 | 9 | 10 | 3.46 | 401 |
| 19000-19999 | 58 | 53 | 16 | 13 | 9 | 10 | 3.48 | 405 |
| 20000-20999 | 61 | 55 | 16 | 12 | 8 | 9 | 3.36 | 372 |
| 21000-21999 | 45 | 58 | 15 | 11 | 8 | 8 | 3.18 | 339 |
| 22000+ | 92 | 59 | 15 | 11 | 7 | 8 | 3.12 | 318 |
Table 14. Average Somatic Cell Count Score by Stage of Lactation for the Northeast Region by Herd Milk Production Level.
| Northeast | ||||||||
|---|---|---|---|---|---|---|---|---|
| Stage of Lactation (Days) | ||||||||
| Herd Avg. (lbs) | Lact. | 1-40 | 41-100 | 101-199 | 200-305 | 306+ | Avg. | |
| 14000-14999 | 1 | 2.99 | 2.34 | 2.60 | 3.09 | 3.36 | 2.81 | |
| 14000-14999 | 2 | 3.28 | 2.62 | 3.34 | 3.83 | 4.14 | 3.69 | |
| 14000-14999 | 3+ | 4.15 | 3.48 | 3.87 | 4.37 | 4.57 | 4.08 | |
| 14000-14999 | All | 3.79 | 2.97 | 3.47 | 3.86 | 4.00 | 3.88 | |
| 15000-15999 | 1 | 2.66 | 2.39 | 2.63 | 2.86 | 3.12 | 2.84 | |
| 15000-15999 | 2 | 3.05 | 2.82 | 3.32 | 3.63 | 4.05 | 3.42 | |
| 15000-15999 | 3+ | 3.49 | 3.55 | 3.68 | 4.29 | 4.72 | 3.84 | |
| 15000-15999 | All | 3.08 | 3.00 | 3.24 | 3.67 | 4.08 | 3.38 | |
| 16000-16999 | 1 | 2.76 | 2.41 | 2.55 | 2.85 | 2.98 | 2.75 | |
| 16000-16999 | 2 | 3.01 | 2.53 | 2.96 | 3.46 | 3.77 | 3.06 | |
| 16000-16999 | 3+ | 3.44 | 3.17 | 3.67 | 4.13 | 4.50 | 3.78 | |
| 16000-16999 | All | 3.02 | 2.70 | 3.19 | 3.56 | 3.83 | 3.21 | |
| 17000-17999 | 1 | 2.65 | 2.30 | 2.54 | 2.80 | 3.08 | 2.61 | |
| 17000-17999 | 2 | 2.50 | 2.43 | 2.88 | 3.30 | 3.87 | 2.94 | |
| 17000-17999 | 3+ | 3.30 | 3.10 | 3.57 | 3.98 | 4.44 | 3.61 | |
| 17000-17999 | All | 2.75 | 2.58 | 3.05 | 3.38 | 3.83 | 2.92 | |
| 18000-18999 | 1 | 2.78 | 2.13 | 2.41 | 2.51 | 3.04 | 2.48 | |
| 18000-18999 | 2 | 2.43 | 2.18 | 2.82 | 3.28 | 3.62 | 2.83 | |
| 18000-18999 | 3+ | 3.25 | 2.84 | 3.45 | 3.99 | 4.30 | 3.50 | |
| 18000-18999 | All | 2.86 | 2.39 | 2.96 | 3.23 | 3.71 | 2.99 | |
| 19000-19999 | 1 | 2.68 | 2.22 | 2.50 | 2.66 | 3.04 | 2.57 | |
| 19000-19999 | 2 | 2.40 | 2.33 | 2.78 | 3.19 | 3.87 | 2.85 | |
| 19000-19999 | 3+ | 3.23 | 3.06 | 3.48 | 3.92 | 4.38 | 3.54 | |
| 19000-19999 | All | 2.85 | 2.48 | 3.02 | 3.24 | 3.74 | 3.05 | |
| 20000-20999 | 1 | 2.74 | 2.03 | 2.33 | 2.43 | 2.88 | 2.42 | |
| 20000-20999 | 2 | 2.38 | 2.15 | 2.67 | 3.18 | 3.66 | 2.79 | |
| 20000-20999 | 3+ | 3.05 | 2.87 | 3.24 | 3.79 | 4.21 | 3.40 | |
| 20000-20999 | All | 2.72 | 2.34 | 2.78 | 3.12 | 3.58 | 2.87 | |
| 21000-21999 | 1 | 2.55 | 1.99 | 2.38 | 2.53 | 2.86 | 2.41 | |
| 21000-21999 | 2 | 2.29 | 2.20 | 2.59 | 3.10 | 3.58 | 2.72 | |
| 21000-21999 | 3+ | 3.11 | 2.73 | 3.29 | 3.78 | 4.18 | 3.33 | |
| 21000-21999 | All | 2.54 | 2.28 | 2.77 | 3.08 | 3.58 | 2.81 | |
| 22000-22999 | 1 | 2.47 | 1.95 | 2.19 | 2.46 | 2.83 | 2.30 | |
| 22000-22999 | 2 | 2.31 | 2.17 | 2.61 | 3.22 | 3.66 | 2.74 | |
| 22000-22999 | 3+ | 3.04 | 2.78 | 3.23 | 3.74 | 4.29 | 3.36 | |
| 22000-22999 | All | 2.64 | 2.23 | 2.70 | 3.12 | 3.58 | 2.83 | |
| 23000-23999 | 1 | 2.38 | 2.04 | 2.19 | 2.45 | 2.78 | 2.33 | |
| 23000-23999 | 2 | 2.22 | 2.07 | 2.51 | 2.99 | 3.50 | 2.62 | |
| 23000-23999 | 3+ | 3.03 | 2.62 | 3.11 | 3.63 | 4.07 | 3.24 | |
| 23000-23999 | All | 2.49 | 2.19 | 2.63 | 2.96 | 3.47 | 2.73 | |
| 24000-24999 | 1 | 2.44 | 1.95 | 2.22 | 2.38 | 2.91 | 2.30 | |
| 24000-24999 | 2 | 2.49 | 2.03 | 2.63 | 3.07 | 3.62 | 2.74 | |
| 24000-24999 | 3+ | 3.18 | 2.72 | 3.34 | 3.82 | 4.27 | 3.41 | |
| 24000-24999 | All | 2.67 | 2.19 | 2.73 | 2.99 | 3.59 | 2.80 | |
| 25000-25999 | 1 | 2.23 | 1.94 | 2.09 | 2.28 | 2.63 | 2.17 | |
| 25000-25999 | 2 | 2.12 | 2.08 | 2.51 | 2.92 | 3.61 | 2.63 | |
| 25000-25999 | 3+ | 3.00 | 2.69 | 3.03 | 3.57 | 4.10 | 3.22 | |
| 25000-25999 | All | 2.35 | 2.18 | 2.57 | 2.84 | 3.42 | 2.64 | |
| 26000-26999 | 1 | 2.23 | 1.71 | 2.03 | 2.29 | 2.80 | 2.16 | |
| 26000-26999 | 2 | 2.46 | 1.90 | 2.43 | 3.04 | 3.43 | 2.66 | |
| 26000-26999 | 3+ | 3.08 | 2.88 | 3.16 | 3.71 | 3.85 | 3.30 | |
| 26000-26999 | All | 2.39 | 2.17 | 2.52 | 2.87 | 3.31 | 2.62 | |
| 27000+ | 1 | 2.16 | 1.73 | 2.11 | 2.47 | 2.78 | 2.22 | |
| 27000+ | 2 | 2.34 | 1.98 | 2.48 | 3.11 | 3.72 | 2.61 | |
| 27000+ | 3+ | 2.67 | 2.90 | 3.23 | 3.73 | 4.07 | 3.30 | |
| 27000+ | All | 2.30 | 2.15 | 2.61 | 2.97 | 3.48 | 2.70 | |
Table 15. Average Somatic Cell Count Score by Stage of Lactation for the Midwest Region by Herd Milk Production Level.
| Midwest | ||||||||
|---|---|---|---|---|---|---|---|---|
| Stage of Lactation (Days) | ||||||||
| Herd Avg. (lbs) | Lact. | 1-40 | 41-100 | 101-199 | 200-305 | 306+ | Avg. | |
| 14000-14999 | 1 | 3.68 | 2.65 | 3.12 | 3.06 | 3.14 | 2.96 | |
| 14000-14999 | 2 | 3.14 | 2.77 | 3.17 | 3.71 | 3.97 | 3.44 | |
| 14000-14999 | 3+ | 4.04 | 3.50 | 4.11 | 4.33 | 4.64 | 4.03 | |
| 14000-14999 | All | 3.54 | 2.99 | 3.50 | 3.65 | 4.01 | 3.63 | |
| 15000-15999 | 1 | 3.12 | 2.63 | 2.90 | 3.05 | 3.19 | 2.94 | |
| 15000-15999 | 2 | 3.01 | 2.78 | 3.02 | 3.64 | 3.74 | 3.32 | |
| 15000-15999 | 3+ | 3.41 | 3.39 | 3.81 | 4.16 | 4.61 | 3.84 | |
| 15000-15999 | All | 3.22 | 2.91 | 3.35 | 3.53 | 3.99 | 3.36 | |
| 16000-16999 | 1 | 3.17 | 2.50 | 2.90 | 2.86 | 3.22 | 2.93 | |
| 16000-16999 | 2 | 2.96 | 2.77 | 3.18 | 3.50 | 3.78 | 3.19 | |
| 16000-16999 | 3+ | 3.70 | 3.32 | 3.66 | 3.95 | 4.43 | 3.78 | |
| 16000-16999 | All | 3.20 | 2.79 | 3.27 | 3.39 | 3.93 | 3.24 | |
| 17000-17999 | 1 | 2.92 | 2.46 | 2.73 | 2.74 | 3.15 | 2.78 | |
| 17000-17999 | 2 | 2.78 | 2.51 | 3.00 | 3.34 | 3.76 | 3.04 | |
| 17000-17999 | 3+ | 3.27 | 3.15 | 3.51 | 3.96 | 4.32 | 3.61 | |
| 17000-17999 | All | 2.96 | 2.65 | 3.10 | 3.25 | 3.73 | 3.06 | |
| 18000-18999 | 1 | 3.06 | 2.36 | 2.71 | 2.66 | 3.11 | 2.76 | |
| 18000-18999 | 2 | 2.67 | 2.47 | 2.95 | 3.33 | 3.85 | 3.02 | |
| 18000-18999 | 3+ | 3.29 | 3.05 | 3.39 | 3.98 | 4.29 | 3.57 | |
| 18000-18999 | All | 3.07 | 2.60 | 3.07 | 3.26 | 3.78 | 3.17 | |
| 19000-19999 | 1 | 2.90 | 2.35 | 2.63 | 2.76 | 3.09 | 2.66 | |
| 19000-19999 | 2 | 2.76 | 2.42 | 2.91 | 3.25 | 3.70 | 2.95 | |
| 19000-19999 | 3+ | 3.32 | 2.87 | 3.46 | 3.85 | 4.34 | 3.53 | |
| 19000-19999 | All | 2.97 | 2.53 | 3.00 | 3.20 | 3.71 | 3.06 | |
| 20000-20999 | 1 | 2.84 | 2.31 | 2.63 | 2.65 | 2.99 | 2.65 | |
| 20000-20999 | 2 | 2.68 | 2.33 | 2.71 | 3.16 | 3.64 | 2.85 | |
| 20000-20999 | 3+ | 3.20 | 2.94 | 3.39 | 3.68 | 4.24 | 3.43 | |
| 20000-20999 | All | 2.87 | 2.49 | 2.93 | 3.06 | 3.64 | 2.98 | |
| 21000-21999 | 1 | 2.84 | 2.27 | 2.55 | 2.64 | 2.95 | 2.60 | |
| 21000-21999 | 2 | 2.62 | 2.35 | 2.75 | 3.20 | 3.67 | 2.88 | |
| 21000-21999 | 3+ | 3.18 | 2.84 | 3.32 | 3.74 | 4.13 | 3.41 | |
| 21000-21999 | All | 2.89 | 2.49 | 2.88 | 3.08 | 3.58 | 2.99 | |
| 22000-22999 | 1 | 2.63 | 2.24 | 2.46 | 2.52 | 2.95 | 2.53 | |
| 22000-22999 | 2 | 2.60 | 2.24 | 2.65 | 3.10 | 3.63 | 2.75 | |
| 22000-22999 | 3+ | 3.12 | 2.83 | 3.23 | 3.60 | 4.07 | 3.34 | |
| 22000-22999 | All | 2.75 | 2.40 | 2.76 | 2.97 | 3.52 | 2.87 | |
| 23000-23999 | 1 | 2.63 | 2.13 | 2.34 | 2.52 | 2.82 | 2.49 | |
| 23000-23999 | 2 | 2.38 | 2.13 | 2.54 | 3.02 | 3.61 | 2.67 | |
| 23000-23999 | 3+ | 2.96 | 2.63 | 3.13 | 3.56 | 3.99 | 3.17 | |
| 23000-23999 | All | 2.62 | 2.25 | 2.68 | 2.93 | 3.44 | 2.79 | |
| 24000-24999 | 1 | 2.58 | 2.05 | 2.32 | 2.38 | 2.96 | 2.39 | |
| 24000-24999 | 2 | 2.35 | 2.04 | 2.60 | 2.95 | 3.42 | 2.68 | |
| 24000-24999 | 3+ | 2.95 | 2.53 | 3.11 | 3.64 | 4.05 | 3.16 | |
| 24000-24999 | All | 2.59 | 2.20 | 2.68 | 2.84 | 3.44 | 2.66 | |
| 25000-25999 | 1 | 2.49 | 2.06 | 2.32 | 2.52 | 2.84 | 2.41 | |
| 25000-25999 | 2 | 2.41 | 2.16 | 2.67 | 2.88 | 3.64 | 2.74 | |
| 25000-25999 | 3+ | 2.91 | 2.76 | 2.96 | 3.42 | 4.13 | 3.15 | |
| 25000-25999 | All | 2.56 | 2.27 | 2.66 | 2.82 | 3.44 | 2.76 | |
| 26000-26999 | 1 | 2.58 | 1.91 | 2.12 | 2.34 | 2.72 | 2.30 | |
| 26000-26999 | 2 | 2.13 | 2.26 | 2.59 | 2.92 | 3.35 | 2.58 | |
| 26000-26999 | 3+ | 3.11 | 2.67 | 3.00 | 3.39 | 3.83 | 3.12 | |
| 26000-26999 | All | 2.55 | 2.23 | 2.53 | 2.76 | 3.28 | 2.61 | |
| 27000+ | 1 | 2.75 | 1.96 | 2.02 | 2.26 | 2.61 | 2.22 | |
| 27000+ | 2 | 2.04 | 1.96 | 2.55 | 2.92 | 3.57 | 2.60 | |
| 27000+ | 3+ | 2.75 | 2.54 | 3.00 | 3.47 | 3.90 | 3.12 | |
| 27000+ | All | 2.40 | 2.16 | 2.52 | 2.81 | 3.30 | 2.61 | |
Table 16. Average Somatic Cell Count Score by Stage of Lactation for the Mid-South Region by Herd Milk Production Level.
| Mid-South | ||||||||
|---|---|---|---|---|---|---|---|---|
| Stage of Lactation (Days) | ||||||||
| Herd Avg. (lbs) | Lact. | 1-40 | 41-100 | 101-199 | 200-305 | 306+ | Avg. | |
| 14000-14999 | 1 | 3.12 | 2.73 | 3.04 | 3.18 | 3.14 | 3.08 | |
| 14000-14999 | 2 | 3.26 | 3.07 | 3.33 | 3.66 | 4.25 | 3.60 | |
| 14000-14999 | 3+ | 3.82 | 3.66 | 4.15 | 4.76 | 4.87 | 4.33 | |
| 14000-14999 | All | 3.38 | 3.29 | 3.72 | 3.88 | 4.20 | 3.80 | |
| 15000-15999 | 1 | 3.14 | 2.64 | 3.04 | 2.99 | 3.26 | 2.91 | |
| 15000-15999 | 2 | 2.91 | 2.86 | 3.04 | 3.72 | 3.81 | 3.29 | |
| 15000-15999 | 3+ | 3.65 | 3.47 | 3.92 | 4.31 | 4.68 | 3.99 | |
| 15000-15999 | All | 3.34 | 3.07 | 3.41 | 3.59 | 4.13 | 3.50 | |
| 16000-16999 | 1 | 3.31 | 2.41 | 2.90 | 2.80 | 3.27 | 2.97 | |
| 16000-16999 | 2 | 2.74 | 2.72 | 3.23 | 3.33 | 4.08 | 3.13 | |
| 16000-16999 | 3+ | 3.53 | 3.28 | 3.90 | 4.16 | 4.66 | 3.85 | |
| 16000-16999 | All | 3.25 | 2.85 | 3.46 | 3.50 | 4.09 | 3.46 | |
| 17000-17999 | 1 | 3.01 | 2.50 | 2.86 | 2.98 | 3.31 | 2.94 | |
| 17000-17999 | 2 | 2.85 | 2.59 | 3.30 | 3.35 | 3.71 | 3.19 | |
| 17000-17999 | 3+ | 3.73 | 3.25 | 3.80 | 4.13 | 4.64 | 3.88 | |
| 17000-17999 | All | 3.23 | 2.93 | 3.35 | 3.44 | 3.96 | 3.35 | |
| 18000-18999 | 1 | 2.97 | 2.37 | 2.73 | 2.84 | 3.24 | 2.90 | |
| 18000-18999 | 2 | 2.75 | 2.50 | 3.06 | 3.46 | 3.84 | 3.04 | |
| 18000-18999 | 3+ | 3.48 | 3.07 | 3.62 | 3.83 | 4.45 | 3.63 | |
| 18000-18999 | All | 3.21 | 2.67 | 3.17 | 3.28 | 3.91 | 3.20 | |
| 19000-19999 | 1 | 2.97 | 2.69 | 2.91 | 2.84 | 3.22 | 2.86 | |
| 19000-19999 | 2 | 2.82 | 2.65 | 3.09 | 3.34 | 3.93 | 3.17 | |
| 19000-19999 | 3+ | 3.37 | 3.28 | 3.66 | 4.08 | 4.49 | 3.69 | |
| 19000-19999 | All | 3.09 | 2.84 | 3.29 | 3.30 | 3.87 | 3.20 | |
| 20000-20999 | 1 | 3.01 | 2.55 | 2.93 | 2.89 | 3.29 | 2.85 | |
| 20000-20999 | 2 | 2.63 | 2.54 | 3.05 | 3.22 | 3.89 | 3.04 | |
| 20000-20999 | 3+ | 3.39 | 3.17 | 3.51 | 4.00 | 4.53 | 3.62 | |
| 20000-20999 | All | 3.06 | 2.79 | 3.17 | 3.30 | 3.88 | 3.19 | |
| 21000-21999 | 1 | 3.04 | 2.38 | 2.75 | 2.85 | 3.03 | 2.77 | |
| 21000-21999 | 2 | 2.58 | 2.50 | 2.94 | 3.20 | 3.71 | 2.92 | |
| 21000-21999 | 3+ | 3.25 | 2.98 | 3.38 | 3.79 | 4.41 | 3.47 | |
| 21000-21999 | All | 3.00 | 2.63 | 3.01 | 3.20 | 3.79 | 3.12 | |
| 22000-22999 | 1 | 2.74 | 2.28 | 2.69 | 2.83 | 3.00 | 2.72 | |
| 22000-22999 | 2 | 2.37 | 2.24 | 2.86 | 3.22 | 3.45 | 2.87 | |
| 22000-22999 | 3+ | 3.14 | 2.96 | 3.39 | 3.81 | 4.24 | 3.45 | |
| 22000-22999 | All | 2.86 | 2.54 | 3.00 | 3.16 | 3.58 | 3.01 | |
| 23000-23999 | 1 | 2.43 | 2.28 | 2.69 | 2.64 | 3.05 | 2.56 | |
| 23000-23999 | 2 | 2.46 | 2.34 | 2.84 | 3.19 | 3.45 | 2.89 | |
| 23000-23999 | 3+ | 3.40 | 2.98 | 3.51 | 3.81 | 4.31 | 3.56 | |
| 23000-23999 | All | 2.78 | 2.55 | 3.06 | 3.05 | 3.69 | 3.03 | |
| 24000+ | 1 | 2.72 | 2.26 | 2.71 | 2.80 | 3.11 | 2.74 | |
| 24000+ | 2 | 2.72 | 2.63 | 3.05 | 3.13 | 3.45 | 3.01 | |
| 24000+ | 3+ | 3.27 | 3.12 | 3.40 | 3.74 | 4.18 | 3.53 | |
| 24000+ | All | 2.96 | 2.67 | 3.03 | 3.12 | 3.63 | 3.09 | |
Table 17. Average Somatic Cell Count Score by Stage of Lactation for the South Region by Herd Milk Production Level.
| South | ||||||||
|---|---|---|---|---|---|---|---|---|
| Stage of Lactation (Days) | ||||||||
| Herd Avg. (lbs) | Lact. | 1-40 | 41-100 | 101-199 | 200-305 | 306+ | Avg. | |
| 14000-14999 | 1 | 3.29 | 2.95 | 3.25 | 3.74 | 3.53 | 3.38 | |
| 14000-14999 | 2 | 2.96 | 3.00 | 3.59 | 3.84 | 4.26 | 3.52 | |
| 14000-14999 | 3+ | 3.77 | 3.80 | 4.11 | 4.59 | 5.02 | 4.20 | |
| 14000-14999 | All | 3.62 | 3.35 | 3.84 | 3.92 | 4.39 | 3.72 | |
| 15000-15999 | 1 | 3.01 | 2.90 | 3.36 | 3.29 | 3.88 | 3.28 | |
| 15000-15999 | 2 | 3.12 | 3.09 | 3.55 | 3.85 | 3.72 | 3.55 | |
| 15000-15999 | 3+ | 3.95 | 3.66 | 3.98 | 4.48 | 4.94 | 4.09 | |
| 15000-15999 | All | 3.40 | 3.43 | 3.81 | 3.81 | 4.24 | 3.72 | |
| 16000-16999 | 1 | 3.06 | 2.70 | 3.52 | 3.10 | 3.53 | 3.14 | |
| 16000-16999 | 2 | 2.95 | 2.70 | 3.35 | 4.09 | 4.04 | 3.38 | |
| 16000-16999 | 3+ | 3.69 | 3.78 | 4.12 | 4.44 | 4.88 | 4.06 | |
| 16000-16999 | All | 3.26 | 3.23 | 3.71 | 3.82 | 4.17 | 3.57 | |
| 17000-17999 | 1 | 3.14 | 3.07 | 3.41 | 3.41 | 3.65 | 3.27 | |
| 17000-17999 | 2 | 2.92 | 2.77 | 3.68 | 3.92 | 4.44 | 3.54 | |
| 17000-17999 | 3+ | 3.75 | 3.74 | 3.76 | 4.54 | 4.84 | 4.08 | |
| 17000-17999 | All | 3.32 | 3.22 | 3.57 | 3.84 | 4.24 | 3.74 | |
| 18000-18999 | 1 | 2.92 | 2.78 | 3.06 | 3.20 | 3.43 | 3.10 | |
| 18000-18999 | 2 | 2.66 | 2.83 | 3.41 | 3.65 | 4.21 | 3.34 | |
| 18000-18999 | 3+ | 3.88 | 3.41 | 3.72 | 4.36 | 4.56 | 3.84 | |
| 18000-18999 | All | 3.14 | 3.01 | 3.47 | 3.67 | 4.04 | 3.47 | |
| 19000-19999 | 1 | 3.06 | 2.75 | 3.23 | 3.25 | 3.65 | 3.17 | |
| 19000-19999 | 2 | 2.81 | 2.82 | 3.36 | 3.72 | 4.13 | 3.30 | |
| 19000-19999 | 3+ | 3.58 | 3.40 | 3.86 | 4.45 | 4.83 | 3.94 | |
| 19000-19999 | All | 3.20 | 3.04 | 3.43 | 3.72 | 4.23 | 3.53 | |
| 20000-20999 | 1 | 3.44 | 2.76 | 3.05 | 3.10 | 3.30 | 3.11 | |
| 20000-20999 | 2 | 2.80 | 2.86 | 3.37 | 3.71 | 3.99 | 3.35 | |
| 20000-20999 | 3+ | 3.58 | 3.29 | 3.74 | 4.12 | 4.69 | 3.81 | |
| 20000-20999 | All | 3.40 | 2.97 | 3.32 | 3.56 | 3.96 | 3.40 | |
| 21000-21999 | 1 | 2.69 | 2.37 | 3.02 | 3.06 | 3.42 | 2.82 | |
| 21000-21999 | 2 | 2.53 | 2.47 | 3.18 | 3.46 | 3.75 | 3.06 | |
| 21000-21999 | 3+ | 3.55 | 3.29 | 3.93 | 4.13 | 4.49 | 3.72 | |
| 21000-21999 | All | 2.91 | 2.70 | 3.28 | 3.37 | 3.96 | 3.19 | |
| 22000+ | 1 | 2.97 | 2.39 | 2.93 | 3.06 | 3.31 | 2.90 | |
| 22000+ | 2 | 2.63 | 2.60 | 2.97 | 3.49 | 3.89 | 3.03 | |
| 22000+ | 3+ | 3.55 | 3.27 | 3.42 | 3.96 | 4.41 | 3.67 | |
| 22000+ | All | 3.09 | 2.80 | 3.09 | 3.37 | 3.85 | 3.22 | |