
2020 plant disease losses in Georgia, including control costs, amounted to an estimated $806 million. The value of the crops used in this estimate was approximately $6.712 billion, resulting in a 12.01% relative disease loss across all crops included in this summary. The estimated values for most crops used to compute these disease losses are summarized in the 2020 Georgia Farm Gate Value Report (AR-22-01) by the UGA Center for Agribusiness & Economic Development.
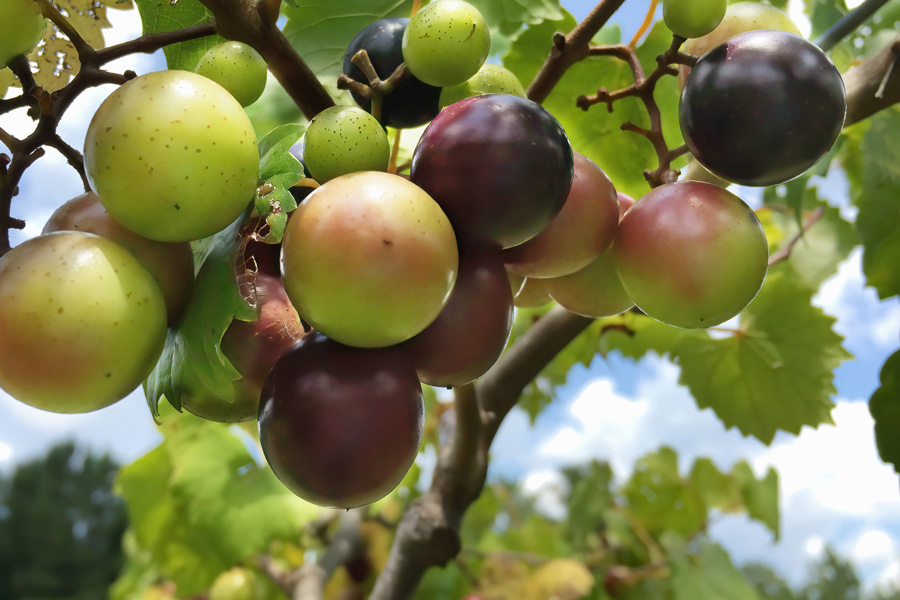
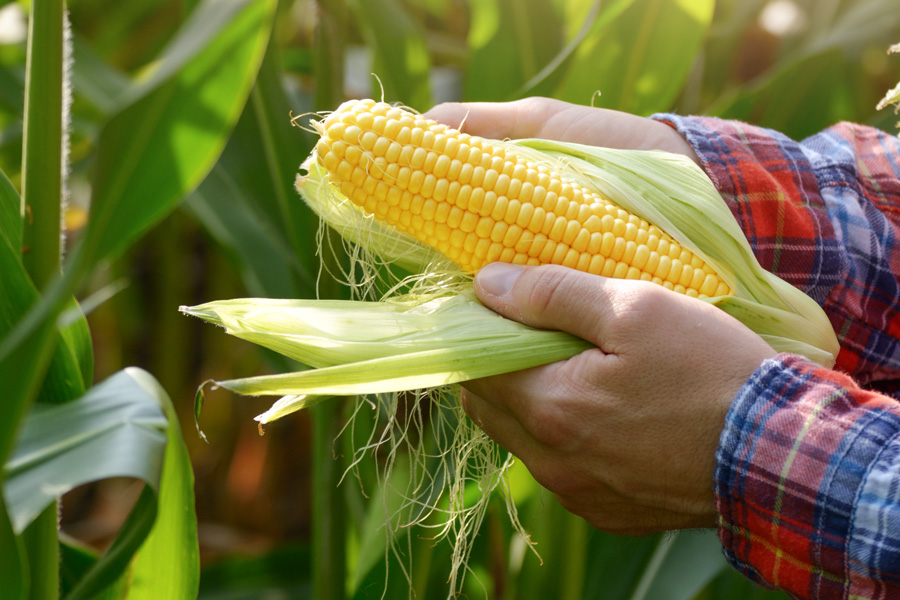
Some estimates for fruits, ornamentals, and turf rely on specialists’ knowledge of the industry and industry sources for information. Losses covered include: apple, blackberry, blueberry, bunch grape, corn, cotton, muscadine grape, ornamentals, peach, peanut, pecan, soybean, strawberry, turfgrass, vegetables, and wheat.
For full details, please see the PDF of this publication. This summary table is provided below for your convenience.
Summary of Total Losses due to Disease Damage and Cost of Control in Georgia – 2020
| Crop or Commodity | Estimated Crop Value ($ Millions) |
% Reduction in Crop Value1 | Value of Damage ($ Millions) |
Cost of Control ($ Millions) |
Total Disease Loss (Damage & Control) ($ Millions) |
Total % of Loss1,2 |
|---|---|---|---|---|---|---|
| Apple | 9.36 | 11.5 | 1.21 | 0.33 | 1.54 | 16.45 |
| Blackberry | 17.96 | 3.28 | 0.61 | 0.82 | 1.43 | 7.96 |
| Blueberry | 304.19 | 10.1 | 34.17 | 12.11 | 46.29 | 15.22 |
| Bunch Grape | 23.04 | 16.9 | 4.67 | 0.48 | 5.16 | 22.4 |
| Corn | 358.1 | 11.1 | 43.0 | 3.6 | 46.6 | 13.01 |
| Cotton | 727.8 | 13.7 | 99.5 | 20.6 | 120.1 | 16.50 |
| Muscadine Grape | 3.78 | 8.2 | 0.34 | 0.19 | 0.52 | 13.8 |
| Ornamentals | 930.11 | 9.35 | 86.96 | 26.91 | 113.87 | 12.24 |
| Peach | 63.64 | 2.3 | 1.51 | 4.865 | 6.38 | 10.03 |
| Peanut | 678.0 | 19.5 | 147.6 | 66.9 | 214.5 | 31.64 |
| Pecan | 282.29 | 8.0 | 22.5 | 30.9 | 53.4 | 18.92 |
| Soybean | 52.0 | 7.7 | 4.4 | 0.45 | 4.85 | 9.33 |
| Strawberry | 11.93 | 34.1 | 6.18 | 1.06 | 7.24 | 60.69 |
| Turfgrass | 1980.00 | 2.0 | 39.6 | 25.70 | 65.30 | 3.30 |
| Vegetable | 1239.30 | 4.86 | 60.2 | 57.5 | 117.7 | 9.5 |
| Wheat | 30.80 | 2.5 | 0.77 | 0.61 | 1.38 | 4.48 |
| Totals | 6712.3 | — | 553.22 | 253.03 | 806.25 | 12.01 |
1This column is not additive.
2Total percent loss for each crop and the grand total is figured on the basis of:
(value of damage + cost control) / crop value