
Main Takeaways
- Although the total harvested area of vegetables and pulses decreased by 3.2% from 2021 to 2022, and fresh and processed vegetable area harvested decreased by 5.1%, the situation is expected to deteriorate in 2024.
- Total imports of vegetables and pulses were $18.7 billion in 2022, an increase of 11.1% compared to 2021. This import trend is expected to continue in 2024.
- Per capita vegetable consumption may make a comeback in 2024 but will not attain the 2020, 2021, or 2022 consumption records.
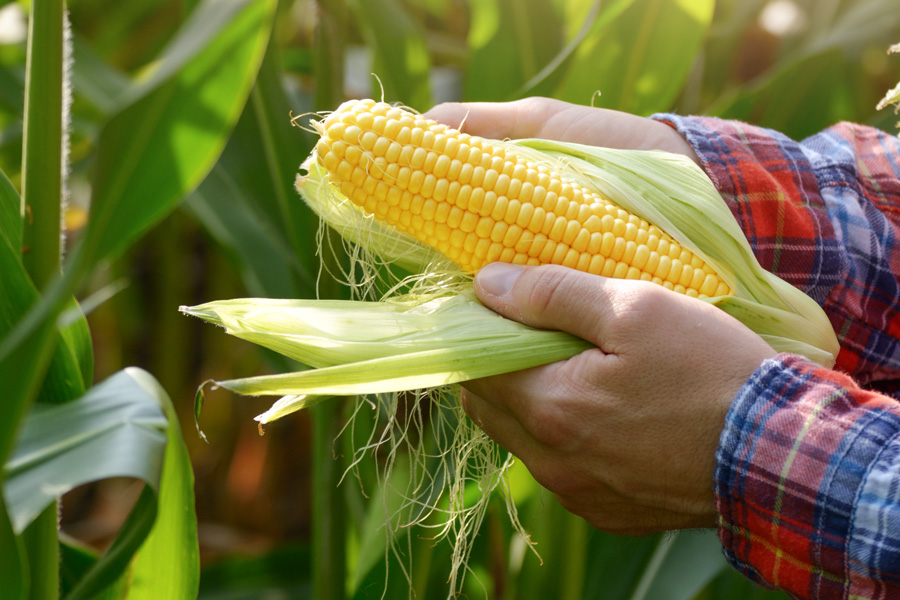
According to U.S. Department of Agriculture’s Economic Research Service and the National Agricultural Statistics Service, overall vegetable area harvested declined by 3.2% in 2022 compared to 2021. Overall is defined as fresh and processed vegetables, potatoes, dry beans, peas, lentils, chickpeas, and mushrooms. Harvested areas for fresh vegetables—which is a major industry in the state of Georgia—and processed vegetables have been trending downward since 2019 and recorded a 5.1% decrease in 2022 compared to 2021. Total production declined 1.6% while total crop value was $22.7 billion, or a 24.1% increase in the same time period (see Table 1).
Because of the 1.6% decline in vegetable production in 2022, total imports from other countries increased by 11.1% in the same time period compared to 2021. In 2021, total imports were $16.8 billion compared to $18.7 billion in 2022. Furthermore, despite the 3.2% decline in harvested area and 1.6% decline in total production, vegetable exports increased by 4.6% in 2022 compared with 2021. In 2021, total exports were $7.3 billion compared to $7.6 in 2022. These trends are expected to continue in 2024 (Table 1).
The USDA report also showed that Americans ate 2.1% less vegetables in 2022 compared to 2021. Per capita consumption of vegetables was highest in 2020 (during the pandemic), when 401 lb were consumed per person. In 2021 and 2022, this quantity declined to 384.7 lb and 376.6 lb, respectively. Although this trend might continue in 2024, it would be better—especially for health reasons—for us to start increasing our vegetable consumption.
| Item | Unit | 2019 | 2020 | 2021 | 2022 | Percent change, 2021–2022 |
|---|---|---|---|---|---|---|
| Area Harvested | ||||||
| Vegetables, fresh and processing/2/8 | 1,000 acres | 2,199 | 2,141 | 2,110 | 2,003 | -5.1 |
| Potatoes/9 | 1,000 acres | 937 | 912 | 924 | 896 | -3 |
| Dry beans, dry peas, lentils, and chickpeas/3 | 1,000 acres | 3,050 | 3,395 | 3,089 | 3,029 | -2 |
| Mushrooms/4 | 1,000 acres | 30 | 27 | 31 | 30 | -3.1 |
| Total | 1,000 acres | 6,217 | 6,476 | 6,154 | 5,958 | -3.2 |
| Production | ||||||
| Vegetables fresh/2/8 | Million cwt | 297 | 288 | 272 | 264 | -2.9 |
| Vegetables processing/2/6 | Million cwt | 352 | 354 | 337 | 333 | -0.9 |
| Potatoes/9 | Million cwt | 424 | 420 | 410 | 392 | -4.3 |
| Dry beans, dry peas, lentils, and chickpeas/3 | Million cwt | 55 | 66 | 37 | 50 | 33.6 |
| Mushrooms/4 | Million cwt | 9 | 8 | 8 | 8 | -7.2 |
| Total | Million cwt | 1,137 | 1,135 | 1,064 | 1,047 | -1.6 |
| Crop Value | ||||||
| Vegetables fresh/2/8 | $ millions | 10,305 | 11,021 | 9,747 | 12,569 | 29 |
| Vegetables processing/2/6 | $ millions | 1,938 | 1,857 | 1,949 | 2,435 | 25 |
| Potatoes/9 | $ millions | 4,217 | 3,907 | 4,174 | 5,070 | 21.4 |
| Dry beans, dry peas, lentils, and chickpeas/3 | $ millions | 1,087 | 1,483 | 1,307 | 1,602 | 22.6 |
| Mushrooms/4 | $ millions | 1,135 | 1,115 | 1,153 | 1,064 | -7.8 |
| Total | $ millions | 18,683 | 19,383 | 18,330 | 22,740 | 24.1 |
| Imports/7 | ||||||
| Vegetables fresh/2/8 | $ millions | 8,511 | 9,523 | 10,008 | 10,689 | 6.8 |
| Vegetables processing/2/6 | $ millions | 3,202 | 3,593 | 3,871 | 4,408 | 13.9 |
| Potatoes/9 | $ millions | 1,529 | 1,734 | 2,019 | 2,543 | 26 |
| Dry beans, dry peas, lentils, and chickpeas/3 | $ millions | 236 | 315 | 355 | 404 | 13.8 |
| Mushrooms/4 | $ millions | 467 | 502 | 595 | 666 | 12 |
| Total | $ millions | 13,946 | 15,667 | 16,847 | 18,709 | 11.1 |
| Exports/7 | ||||||
| Vegetables fresh/2/8 | $ millions | 2,392 | 2,306 | 2,397 | 2,471 | 3.1 |
| Vegetables processing/2/6 | $ millions | 2,196 | 2,038 | 2,255 | 2,373 | 5.2 |
| Potatoes/9 | $ millions | 1,925 | 1,675 | 1,873 | 2,080 | 11 |
| Dry beans, dry peas, lentils, and chickpeas/3 | $ millions | 620 | 782 | 734 | 674 | -8.2 |
| Mushrooms/4 | $ millions | 44 | 42 | 42 | 39 | -5.6 |
| Total | $ millions | 7,177 | 6,844 | 7,301 | 7,637 | 4.6 |
| Per Capita Availability | ||||||
| Vegetables fresh/2/8 | Pounds | 148.8 | 147.8 | 145.4 | 143.1 | -1.6 |
| Vegetables processing/2/6 | Pounds | 113.1 | 123.2 | 112 | 108.6 | -3 |
| Potatoes/9 | Pounds | 112.6 | 115 | 112.9 | 110.7 | -2 |
| Dry beans, dry peas, lentils, and chickpeas/3 | Pounds | 10.3 | 11.2 | 10.7 | 10.8 | 1 |
| Mushrooms/4 | Pounds | 3.8 | 3.7 | 3.7 | 3.5 | -6.7 |
| Total | Pounds | 388.6 | 401 | 384.7 | 376.6 | -2.1 |
| Note. Hundredweight (cwt) = 100 lb. $ millions = million U.S. dollars. 1/ Total values rounded. 2/ Utilized production excluding melons. 3/ Includes Austrian winter and wrinkle seed peas where applicable. 4/ Mushroom area equals total fillings (multiple mushroom crops). 5/ Ratio of total value to total production. 6/ Includes canned, frozen, and dried. Excludes potatoes, pulses, and mushrooms. 7/ All international trade data are expressed on a calendar year basis. 8/ Includes both fresh and processed sweet potatoes. 9/ Includes both fresh and processed. From “Vegetable and Pulse Outlook: April 16, 2023” (Publication No. VGS-370) by the U.S. Department of Agriculture Economic Research Service. |
||||||
Vegetable growers and the vegetable industry at large were hard hit by a sudden increase in input prices in the first quarter of 2022, which affected planting decisions for 2023 and will continue to be considered in production decisions in 2024. The input price increases were mostly blamed on supply chain disruptions, post-pandemic surges, transportation, imposed duties on fertilizers, insufficient crude oil inventories, and the Ukraine war. According to the USDA ERS report, energy and energy-based manufactured inputs account for about one-fourth of the production expenses of specialized vegetable farms. With energy costs up substantially, the vegetable production sector paid at least 16% more for the inputs required to produce, pack, and ship vegetables in the first quarter of 2022 (see Table 2).
| Input | Annual average | First quarter (January–March) | ||||
| 2020 | 2021 | 2022 | 2022 | 2023f | % Change 2021–2022 |
|
| Seeds and plants | 113.1 | 117.6 | 117.3 | 117.3 | 117.3 | 0 |
| Fertilizer, nitrogen | 69.9 | 90.9 | 151.6 | 150 | 123.3 | -17.8 |
| Fertilizer, potash/phosphate | 68.1 | 85.1 | 110.1 | 111 | 93.3 | -15.9 |
| Chemicals, insecticides | 93.2 | 98.7 | 137.6 | 110.7 | 135.6 | 22.5 |
| Chemicals, herbicides | 96.4 | 105.3 | 146.8 | 118.1 | 144.7 | 22.5 |
| Chemicals, fungicides/other | 94.7 | 97.8 | 136.4 | 109.8 | 134.5 | 22.5 |
| Fuels, diesel | 52.5 | 73.3 | 112.9 | 96.9 | 99.7 | 3 |
| Fuels, gasoline | 59.6 | 78.5 | 104.4 | 97.1 | 89.9 | -7.4 |
| Farm machinery | 124.8 | 145.6 | 171.4 | 163.7 | 176.3 | 7.7 |
| Farm supplies | 117.4 | 127.5 | 142.1 | 137.5 | 145 | 5.4 |
| Custom services | 119.6 | 114.7 | 126 | 126 | 126 | 0 |
| Building materials | 120.8 | 140.5 | 163.6 | 160.1 | 164.7 | 2.9 |
| Cash rent | 124.5 | 124.5 | 126.1 | 126.1 | 129 | 2.3 |
| Interest | 110.9 | 111.4 | 112.9 | 128.6 | 142.7 | 11 |
| Taxes | 126.8 | 130 | 134.9 | 138.1 | 143.8 | 4.1 |
| Wage rates | 138.2 | 146.1 | 156.9 | 157.6 | 158.4 | 0.5 |
| Crop sector/2 | 111.1 | 119 | 134.5 | 132 | 137 | 3.8 |
| Vegetable sector/3 | 113.1 | 121.3 | 138.8 | 135.5 | 137 | 1.1 |
| Note. f = forecast. 2/ Input items common to crop production. 3/ Input items common to vegetable production weighted by 2006 vegetable farm expenses derived from the 2006 Agricultural Resource Management Survey. From “Vegetable and Pulse Outlook: April 16, 2023” (Publication No. VGS-370) by the U.S. Department of Agriculture Economic Research Service. |
||||||
For instance, although there was no change in seeds and plants prices, the prices of insecticides, herbicides, and fungicides increased by a resounding 22.5%. Interest rates also increased by 11%, while taxes increased by 4.1%. These increases are enough to put the farmer out of business. Although chances are that some of these skyrocketing input prices will continue at a decreasing rate in 2024, the reverse situation would be helpful for our growers.