- Preface
- Cooperators and Contributors
- The Season with 1999-2000 Rainfall
- Small Grain Cultural Practices
- Characteristics of Varieties
- Small Grains Updates
- Grain Test Results
- Wheat – Grain
- State Variety Trials
- Tifton, Georgia: Wheat Grain Performance, 1999-2000
- Tifton, Georgia: Wheat Grain Performance with Foliar Fungicide, 1999-2000
- Tifton, Georgia: Effect of Fungicide on Wheat Grain Yield, 1999-2000
- Tifton, Georgia: Late-Planted Wheat Grain Performance, 1999-2000
- Tifton, Georgia: Late-Planted Wheat Grain Performance with Foliar Fungicide, 1999-2000
- Tifton, Georgia: Effect of Fungicide on Late-Planted Wheat Grain Yield, 1999-2000
- Plains, Georgia: Wheat Grain Performance, 1999-2000
- Plains, Georgia: Late-Planted Wheat Grain Performance, 1999-2000
- Midville, Georgia: Wheat Grain Performance, 1999-2000
- Midville, Georgia: Late-Planted Wheat Grain Performance, 1999-2000
- Griffin, Georgia: Wheat Grain Performance, 1999-2000
- Calhoun, Georgia: Wheat Grain Performance, 1999-2000
- Summary of Wheat Yields, Georgia, 1998-2000 with Two- and Three-Year Averages
- Summary of Late-Planted Wheat Yields, Georgia, 1999-2000
- Southern Uniform Tests
- Plains, Georgia: Uniform Southern Soft Red Winter Wheat Nursery, 1999-2000
- Griffin, Georgia: Uniform Southern Soft Red Winter Wheat Nursery, 1999-2000
- Triticale
- Tifton, Georgia: Triticale Grain Performance, 1999-2000
- Plains, Georgia: Triticale Grain Performance, 1999-2000
- Midville, Georgia: Triticale Grain Performance, 1999-2000
- Summary of Triticale Yields, Georgia, 1999-2000
- Oat
- Tifton, Georgia: Oat Grain Performance, 1999-2000
- Plains, Georgia: Oat Grain Performance, 1999-2000
- Midville, Georgia: Oat Grain Performance, 1999-2000
- Griffin, Georgia: Oat Grain Performance, 1999-2000
- Calhoun, Georgia: Oat Grain Performance, 1999-2000
- Summary of Oat Yields, Georgia, 1998-2000 with Two- and Three-Year Averages
- Barley
- Plains, Georgia: Barley Grain Performance, 1999-2000
- Calhoun, Georgia: Barley Grain Performance, 1999-2000
- Summary of Barley Yields, Georgia, 1998-2000 with Two- and Three-Year Averages
- Rye
- Tifton, Georgia: Rye Grain Performance, 1999-2000
- Griffin, Georgia: Rye Grain Performance, 1999-2000
- Summary of Rye Yields, Georgia, 1998-2000 with Two- and Three-Year Averages
- Forage Test Results
- Wheat
- Tifton, Georgia: Wheat Forage Performance, 1999-2000
- Plains, Georgia: Wheat Forage Performance, 1999-2000
- Griffin, Georgia: Wheat Forage Performance, 1999-2000
- Quincy, Florida: Wheat Forage Performance, 1999-2000
- Statewide Summary: Wheat Forage Performance, 1998-2000 with Two- and Three-Year Averages
- Oat
- Tifton, Georgia: Oat Forage Performance, 1999-2000
- Plains, Georgia: Oat Forage Performance, 1999-2000
- Griffin, Georgia: Oat Forage Performance, 1999-2000
- Quincy, Florida: Oat Forage Performance, 1999-2000
- Statewide Summary: Oat Forage Performance, 1998-2000 with Two- and Three-Year Averages
- Rye
- Tifton, Georgia: Rye Forage Performance, 1999-2000
- Plains, Georgia: Rye Forage Performance, 1999-2000
- Griffin, Georgia: Rye Forage Performance, 1999-2000
- Quincy, Florida: Rye Forage Performance, 1999-2000
- Statewide Summary: Rye Forage Performance, 1998-2000 with Two- and Three-Year Averages
- Ryegrass
- Tifton, Georgia: Ryegrass Forage Performance, 1999-2000
- Plains, Georgia: Ryegrass Forage Performance, 1999-2000
- Griffin, Georgia: Ryegrass Forage Performance, 1999-2000
- Quincy, Florida: Ryegrass Forage Performance, 1999-2000
- Statewide Summary: Ryegrass Forage Performance, 1998-2000 with Two- and Three-Year Averages
- Sources of Seed for the 1999-2000 Small Grains Performance Tests
Preface
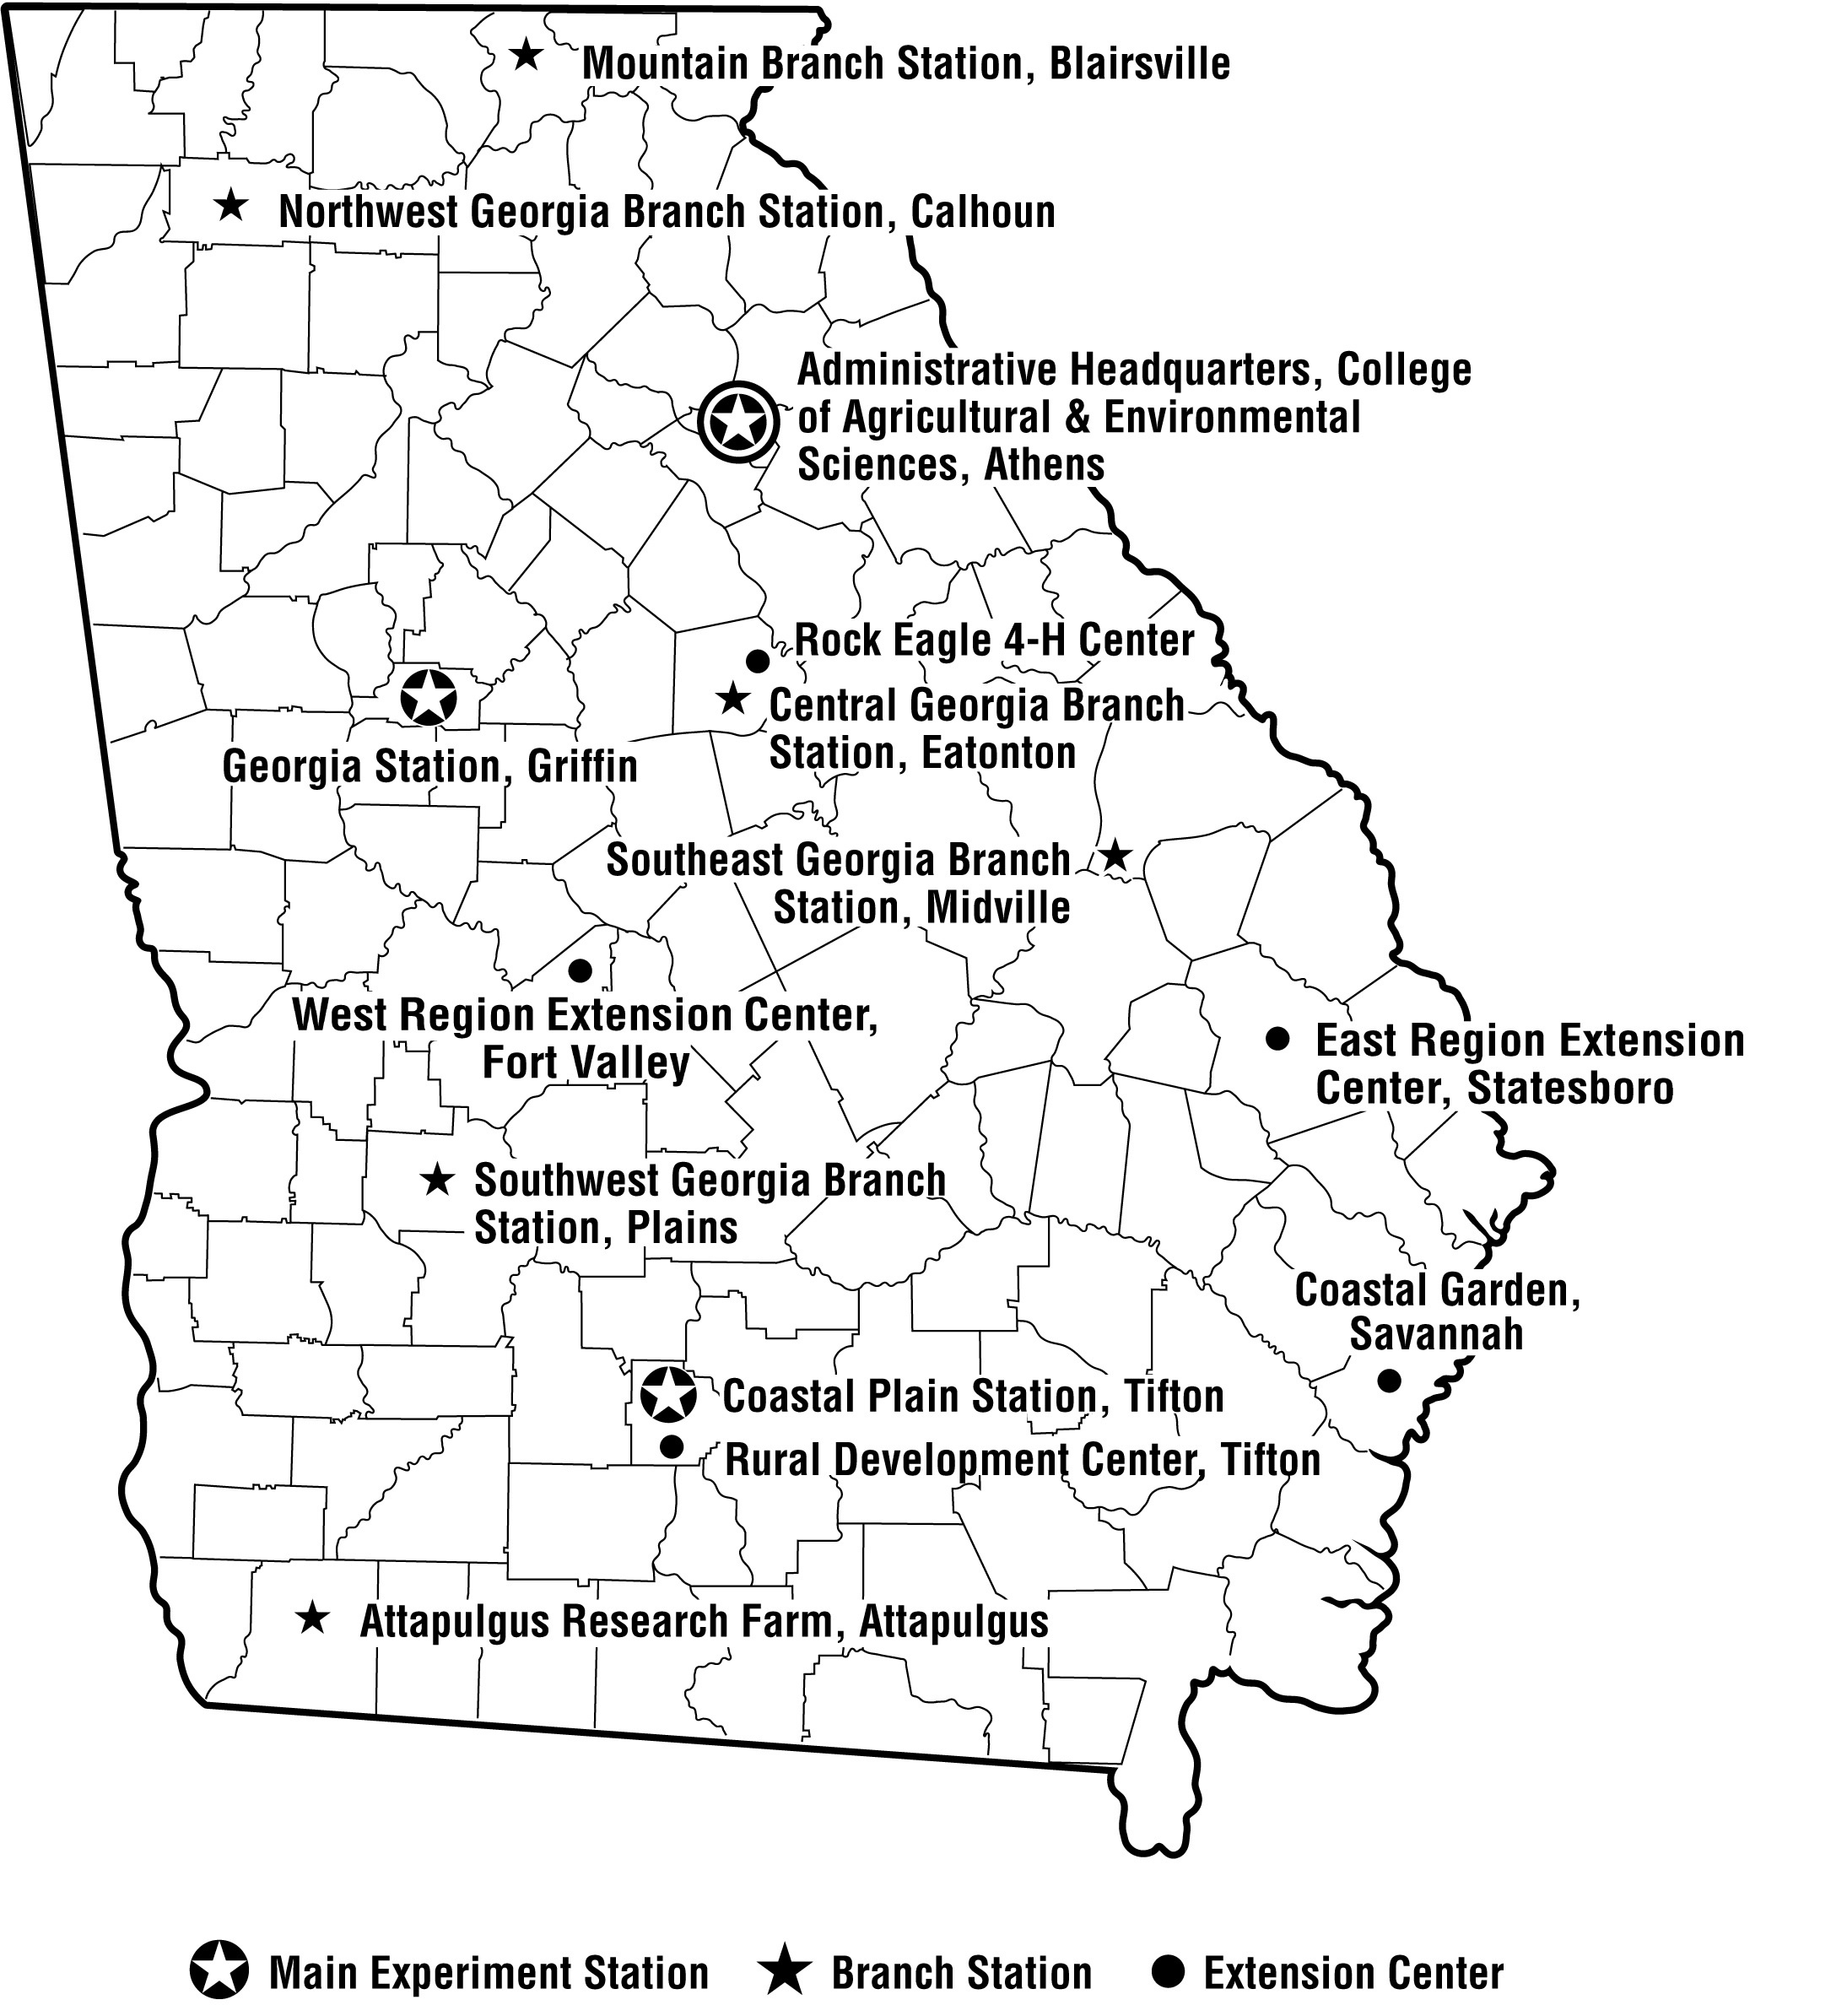
Results of the 1999-2000 performance tests of small grains grown for grain and forage are printed in this research report. Grain-evaluation studies were conducted at five locations, including Tifton, Plains, and Midville in the Coastal Plain region, Griffin in the Piedmont region, and Calhoun in the Limestone Valley region. Small grain forage evaluation tests were conducted at three locations in Georgia, which included Tifton and Plains in the Coastal Plain, Griffin in the Piedmont, and at Quincy, Florida. For identification of the test locations, consult the map below.
Grain yields are reported as bushels per acre at 13.5 percent moisture for wheat, 13 percent for triticale and rye, 12.5 percent moisture for oats, and 12 percent moisture for barley. Additional agronomic data such as plant height, lodging, disease incidence, etc., are listed along with the corresponding yield data. Information concerning culture and fertilizer practices used is included in footnotes. Since the average yield from several years indicates a variety’s potential better than a single year’s data, multiple-year yield summaries are included.
In order to have a broad base of information, a number of varieties, including experimental lines, are included in the tests, but this does not imply that all are recommended for Georgia. Varieties best suited to a specific area or for a particular purpose and agreed upon by College of Agriculture scientists are presented in the Small Grain Cultural Practices section and also in the 2000 Fall Planting Schedule for Georgia (available at your county extension office). For additional information, contact your local county extension agent or the nearest experiment station.
The Least Significant Difference (LSD) at the ten percent level has been included in the tables to aid in comparing varieties and tests. If the yields of any two varieties differ by the LSD value or more, they may be considered different. Bolding is used in the performance tables to indicate entries with yields statistically equal to the highest yielding entry in the test. The standard error (Std. Err.) of an entry mean is included at the bottom of each table to provide a general indicator of the level of precision of each variety experiment. The lower the value for the standard error of the entry mean, the more precise the experiment.
This report is one of four publications presenting the performance of agronomic crops in Georgia. For information concerning other crops, refer to one of the following research reports: 1999 Corn Performance Tests (Report 661), 1999 Soybean, Sorghum Grain and Silage, Grain Millet, and Summer Annual Forages Performance Tests (Report 663), 1999 Peanut, Cotton and Tobacco Performance Tests (Report 664), and 1999-2000 Canola Performance Tests (Report 667).
This report, along with performance test information on other crops, is also available at our web site www.swvt.uga.edu. Additional information may be obtained by writing to Mr. J. LaDon Day, Department of Crop and Soil Sciences, Georgia Station, 1109 Experiment Street, Griffin, GA 30223-1797.
Cooperators
Dr. A. R. Blount, North Florida Research & Education Center, Quincy, Florida.
Dr. D. C. Bridges, Crop and Soil Sciences Department, Georgia Station, Griffin, Georgia.
Dr. G. D. Buntin, Entomology Department, Georgia Station, Griffin, Georgia.
Dr. B. M. Cunfer, Plant Pathology Department, Georgia Station, Griffin, Georgia.
Dr. G. Hoogenboom, Biological and Agricultural Engineering Department, Georgia Station, Griffin, Georgia.
Dr. J. W. Johnson, Crop and Soil Sciences Department, Georgia Station, Griffin, Georgia.
Mr. S. R. Jones, Southwest Branch Station, Plains, Georgia.
Mr. R. D. McNeill IV, Southeast Branch Station, Midville, Georgia.
Mr. C. E. Perry, Southeast Branch Station, Midville, Georgia.
Mr. R. R. Pines, Southwest Branch Station, Griffin, Georgia.
Mr. J. Quick, Georgia Station, Griffin, Georgia.
Mr. G. Rawls, Northwest Branch Station, Calhoun, Georgia.
Mr. P. C. Worley, Northwest Branch Station, Calhoun, Georgia.
Contributors
The following individuals contributed to the gathering of data and the preparation of this report: D. Bland, M. Flynn, M. Gilmer, D. Gresham, T. Hancock, G. Henderson, D. Lee, M. Pippin, J. Stubbs, S. Sutton, W. Tucker, and J. Youmans.
The Season
The Fall of 1999 was the second year in a row that most Georgia small grain producers faced the challenge of planting a small grain crop into dry soils. They met the challenge as planting continued at a normal pace throughout the season. Wheat acreage planted was estimated at 300,000 acres, an increase of 20 percent over the previous year. Oat acreage increased 20 percent, while rye acreage declined 8 percent.
Severe drought growing conditions that the state of Georgia has been experiencing for the past two years continued through the completion of the 2000 small grain crop year. Rainfall amounts recorded monthly at the five test locations during the 1999-2000 growing season are presented in the following table. Most areas of the state continue to receive record low rainfall. Locations at Calhoun, Plains, and Tifton received only about 55 percent of normal rainfall, averaging around 15 inches less than long-term eight-month average.
| 1999-2000 Rainfall1 | ||||||
| Month | Year | Calhoun2 | Griffin | Midville | Plains | Tifton |
| ———————————— inches ———————————— | ||||||
| October | 1999 | 2.97 | 3.69 | 4.27 | 1.93 | 0.73 |
| November | 1999 | 1.80 | 3.55 | 1.49 | 2.08 | 1.26 |
| December | 1999 | 1.12 | 2.73 | 1.64 | 2.83 | 2.32 |
| January | 2000 | 3.69 | 5.70 | 4.98 | 3.41 | 3.34 |
| February | 2000 | 1.63 | 0.96 | 1.08 | 0.96 | 1.90 |
| March | 2000 | 3.58 | 3.17 | 4.83 | 5.72 | 4.72 |
| April | 2000 | 5.04 | 1.31 | 0.85 | 1.24 | 1.32 |
| May | 2000 | 1.07 | 1.51 | 1.18 | 0.31 | 0.03 |
| Total (8 months) | 20.90 | 22.62 | 20.32 | 18.48 | 15.62 | |
| Normal (8 months) | 37.91 | 33.43 | 28.12 | 31.55 | 28.09 | |
| 1. Data collected by Dr. G. Hoogenboom, Georgia Station, Griffin, GA. 2. Floyd County location. |
||||||
Overall, the 1999-2000 small grain growing season in Georgia was characterized by a mild and dry winter followed by a very dry and hot spring. Lack of adequate vernalization was a problem especially for the late maturing varieties. There were some trouble spots of buildup but low levels of disease and insects helped farmers produce excellent yields and test weights. Farmers not rotating ground planted to small grains is an increasing production problem.
Small grain harvest progressed rapidly during a very hot and dry May and June. Growers harvested 240,000 acres of wheat for grain. This was a 7 percent increase above last year of harvested wheat and a near record estimated 52 bushels per acre produced 29 percent more than 1999. Oat yields increased 2 bushels per acre, while rye yields were unchanged at 21 bushels per acre.
Small Grain Cultural Practices
E. Dewey Lee, Extension Agronomist, Tifton, Georgia
Fertilization
Soil samples should be taken from all fields to be planted in small grains, whether for grain or grazing. Soil testing prior to planting aids in determining the amount and type of fertilizer needed to produce a small grain crop. This practice may prevent excessive expenditures where the soil fertility level is very high, and it ensures that the nutritional needs of the crop are met.
Lime should be applied to maintain the soil pH at a target pH of 6.0. If the small grains are to be grazed or if magnesium (Mg) levels are low, dolomitic lime (high Mg) should be used. Adequate amounts of lime should be applied to the previous crop to assure that the soil pH is in the desired range prior to planting small grains. However, if soils tests indicate the need for lime, it should be applied as soon as possible in order to allow adequate time for the soil pH change to occur (usually two to three months or more, depending on fineness of grind).
The table below show the recommended rates of fertilizer N-P205-K20 to apply to small grain, based on soil test levels:
| Soil Test Rating for Potassium (K20) | |||||
| Low | Medium | High | Very High | ||
| Low | *-80-80 | *-80-40 | *-80-0 | *-80-0 | |
| Medium | *-40-80 | *-40-40 | *-40-0 | *-40-0 | |
| High | *-0-80 | *-0-40 | *-0-0 | *-0-0 | |
| Very High | *-0-80 | *-0-40 | *-0-0 | *-0-0 | |
| *For small grain following a legume, apply 60-80 lb N/acre; for small grain following cotton, corn, etc., apply 80-100 lb N/acre; for small grain following grain sorghum, apply 100-120 lb N/acre. Apply 20-40 lb of recommended N/acre in the fall and the remainder in February. For grazing, increase the total N fertilizer rate by 60 lb N/acre and apply in two applications — one-half in the fall and the remainder in midwinter. | |||||
Planting
Small grain seed should be planted in a well-prepared, firm, moist seedbed. Moldboard plowing or chisel plowing is recommended in preference to disc harrowing. The seed should be planted 1 to 1.5 inches deep. The proper planting date for small grain is important for both grain and forage production. Some factors to consider in determining the date for planting small grains include variety, geographic location, weather patterns, soil moisture, and intended use of the crop. If irrigation is available, the planting date can be more flexible. The following table shows recommended planting dates in Georgia:
| Recommended Planting Dates | ||||||
| Crop | Coastal Plain | Piedmont | Limestone Valley | |||
| Grain | Grazing | Grain | Grazing | Grain | Grazing | |
| Wheat | 11/07* – 12/01 | 10/15 | 10/25 – 11/15 | 10/01 | 10/10 – 11/01 | 9/15 |
| Oat | 11/07 – 12/01 | 10/01 | 10/07 – 10/30 | 9/15 | 9/25 – 10/15 | 9/01 |
| Barley | 11/07 – 12/01 | 10/15 | 10/25 – 11/15 | 10/01 | 10/01 – 11/01 | 9/01 |
| Triticale | 11/15 – 12/15 | — | — | — | — | — |
| Rye | 11/07 – 12/01 | 10/15 | 10/07 – 11/15 | 10/01 | 10/01 – 10/20 | 9/01 |
| *November 7 in the Upper Coastal Plain and November 15 in the Lower Coastal Plain. | ||||||
Pest Control
Check with your county extension agent for the latest information on weed, disease, and insect control in small grains.
Varieties
Select high-yielding, insect- and disease-resistant varieties for best results. In selecting varieties, give careful consideration to the statistics (LSD) reported in the tables. An explanation of their proper use is given in the preface to this report. The variety listed at the top of the list may be only one of the best.
For late planting, the early-maturing varieties usually perform the best. Varieties recommended for the 2000 planting season are presented in the table below.
| Recommended Grain Varieties for 2000 | |||
| Barley | GA-Luttrell (S)1 | Nomini (S) | Starling (P, M) |
| Oat | Arkansas Co. 811 (P, M)2 Chapman (C) |
Horizon 314 (S) NC Rodgers (P, M)2 |
Secretariat (C) |
| Wheat | AgriPro Hickory (P, M)2 AgriPro Mason (UC, P)2,4 Fleming (C)3 Jackson (P, M)2,4 Jaypee (P, M)2 |
NK Coker 9663 (S)2,4 NK Coker 9704 (P, M)2,4 NK Coker 9803 (M, P)4 NK Coker 9835 (S)2 *Pioneer 2643 (P, M)2 |
Pioneer 2684 (S)2,4 Pioneer 2691 (C, P)2,4 Pioneer 26R61 (S) Roberts (P, M)2x USG 3209 (S)4 |
| 1. M = Mountains; P = Piedmont; C = Coastal Plain; UC = Upper Coastal Plain; LC = Lower Coastal Plain; S = Statewide. 2. Highly susceptible to powdery mildew, leaf rust, or crown rust; consider using a fungicide. 3. Plant at end of recommended planting period or later. 4. Susceptible to Hessian fly; consider using an insecticide. * To be dropped from the 2001 recommended list. |
|||
| Recommended Forage Varieties for 2000 | ||||
| Oat | Arkansas Co. 604 (S) Chapman (S) |
Coker 227 (C) Harrison (S) |
Horizon 314 (S) NC Rodgers (S) |
|
| Rye | Elbon (S) Gurley GI-87 (S) Kelly Grazer II (LC) |
Maton (S) Oklon (S) Wintergrazer 70 (S) |
Wintermore (S) Wrens Abruzzi (S) Wrens 96 (S) |
|
| Wheat | Jackson (P, M) | *NK Coker 9134 (S) | Roberts (S) | |
| 1. M = Mountains; P = Piedmont; C = Coastal Plain; UC = Upper Coastal Plain; LC = Lower Coastal Plain; S = Statewide. To be dropped from the 2001 recommended list. |
||||
To ensure good germination, the absence of noxious weeds, and varietal purity plant certified, treated seed. General seeding rate recommendations based on bushels per acre are provided in Table 1. Seed size varies greatly from year to year and among varieties and seed lots. Therefore, more accurate plant populations may be achieved by using seeding rates based on seeds per area rather than on bushels per acre. For example, research on wheat has shown that seeding rates near 35 seeds per square foot are best for top yields. Accurate target populations are best achieved by adjusting grain drill settings based on number of seed per foot of row. Grain drill calibrations can be accomplished quickly and accurately by counting seed collected from one or more rows during travel over a specified distance and calculating the drill output as seeds per foot of row. Table 2 is provided as a guide to establish target populations of the small grain crops for popular row spacings. The figures in Table 2 are broadly based on the average number of seeds per pound for the various crops but even more accurate calibrations can be accomplished if the actual number of seeds per pound is known for the seed lot being planted. At least one seed supplier in the Southeast now prints seed size information on the bag. If seed size is known, Table 3 may more accurately predict seed requirements.
| Table 1. Recommended Seeding Rates for 2000 | |||
| Crop | Weight | Grain | Grazing |
| lb/bu | ———– bu/acre ———– | ||
| Wheat | 60 | 2.0-2.5 | 2.0-2.5 |
| Oat | 32 | 2.0 | 4.0 |
| Barley | 48 | 2.0-2.5 | — |
| Rye | 56 | 1.0-1.5 | 2.0-2.5 |
| Triticale | 48 | 1.5-2.0 | 2.0-2.5 |
| Table 2. Example of seeding rate of different small grains. | |||||||
| Crop | Seeding Rate | Row Width (inches) | |||||
| 6 | 7 | 8 | 10 | ||||
| seeds/sq.ft. | lb/A1 | bu/A1 | — seed per foot of row — | ||||
| Barley | 19 | 72 | 1.5 | 10 | 11 | 13 | 16 |
| 25 | 96 | 2.0 | 13 | 15 | 17 | 21 | |
| 32 | 120 | 2.5 | 16 | 19 | 21 | 27 | |
| Oat | 19 | 64 | 2.0 | 10 | 11 | 13 | 16 |
| 24 | 80 | 2.5 | 12 | 14 | 16 | 20 | |
| 28 | 96 | 3.0 | 14 | 16 | 19 | 23 | |
| 38 | 128 | 4.0 | 19 | 22 | 25 | 32 | |
| Wheat | 27 | 90 | 1.5 | 14 | 16 | 18 | 23 |
| 37 | 120 | 2.0 | 18 | 22 | 25 | 31 | |
| 47 | 150 | 2.5 | 24 | 27 | 31 | 39 | |
| 55 | 180 | 3.0 | 28 | 32 | 37 | 46 | |
| Rye | 31 | 56 | 1.0 | 16 | 18 | 21 | 26 |
| 46 | 84 | 1.5 | 23 | 27 | 31 | 38 | |
| 62 | 112 | 2.0 | 31 | 36 | 41 | 52 | |
| 1.Estimates based on average seeds per pound of 11,500 for barley, 12,875 for oat, 13,250 for wheat, and 24,000 for rye. Data compiled by J. L. Day, Georgia Station, Griffin, Georgia. |
|||||||
| Table 3. Seeding rates for wheat based on seed size1. | |||||||
| Seed Size seeds/lb |
Desired Population (seeds per square foot) | ||||||
| 30 | 32 | 34 | 35 | 36 | 38 | 40 | |
| Seeding Rate ———————————- lb/A ———————————- |
|||||||
| 10,000 | 145 | 155 | 165 | 169 | 174 | 184 | 194 |
| 11,000 | 132 | 141 | 150 | 154 | 158 | 167 | 176 |
| 12,000 | 121 | 129 | 137 | 141 | 145 | 153 | 161 |
| 13,000 | 112 | 119 | 127 | 130 | 134 | 141 | 149 |
| 14,000 | 104 | 111 | 118 | 121 | 124 | 131 | 138 |
| 15,000 | 97 | 103 | 110 | 113 | 116 | 123 | 129 |
| 16,000 | 91 | 97 | 103 | 106 | 109 | 115 | 121 |
| 17,000 | 85 | 91 | 97 | 100 | 102 | 108 | 114 |
| 18,000 | 81 | 86 | 91 | 94 | 97 | 102 | 108 |
| 1. Seeding rate assumes 90% germination. | |||||||
Characteristics of Varieties, 2000
| Wheat | |||||||||
| Brand- Variety | Resistance | Test Weight | Maturity | Straw Strength | Vernali-zation | ||||
| Leaf Rust | Glume Blotch | Powdery Mildew | BYD | Hessian Fly | |||||
| AGS 2000 | good | fair | good | fair | good | good | medium | fair | medium |
| AgriPro Hickory | poor | fair | fair | fair | fair | fair | medium | fair | medium |
| AgriPro Mason | good | fair | poor | fair | poor | good | early | good | short |
| Fleming | good | fair | good | poor | good | good | early | fair | short |
| Jackson | poor | fair | fair | fair | poor | good | late | good | long |
| Jaypee | poor | fair | poor | good | poor | good | medium | fair | medium |
| NK Coker 9134 | poor | good | poor | fair | poor | good | late | fair | long |
| NK Coker 9663 | good | good | poor | good | fair | good | medium | good | medium |
| NK Coker 9704 | poor | fair | poor | good | poor | good | late | good | long |
| NK Coker 9803 | good | good | fair | fair | poor | good | late | good | long |
| *NK Coker 9835 | poor | fair | fair | poor | good | fair | medium | good | medium |
| Pioneer 2643 | poor | fair | poor | fair | poor | fair | late | good | long |
| Pioneer 2684 | poor | good | good | fair | good | good | medium | good | medium |
| Pioneer 2691 | fair | fair | fair | fair | fair | fair | early | good | very short |
| Pioneer 26R61 | good | fair | good | fair | good | good | medium | good | medium |
| Roberts | poor | good | good | fair | good | good | late | fair | medium-long |
| USG 3209 | fair | fair | good | fair | poor | fair | medium | good | medium |
| * Susceptible to stem rust. | |||||||||
| Oat | ||||||
| Brand- Variety | Resistance | Cold Hardiness | Maturity | Test Weight | Straw Strength | |
| Crown Rust | BYD | |||||
| Arkansas Co. 604 | excellent | fair | good | late | fair | good |
| Arkansas Co. 811 | poor | poor | good | medium | good | poor |
| Chapman | good | fair | fair | early | fair | good |
| Horizon 314 | good | fair | good | medium | good | good |
| NC Rodgers | poor | poor | good | medium | fair | poor |
| Secretariat | fair | fair | good | medium | good | good |
| Barley | |||||||
| Brand- Variety | Resistance | Maturity | Test Weight | Head Type | |||
| Glume Blotch | Spot Blotch | Scald | Hessian Fly | ||||
| GA-Luttrell | fair | good | good | poor | early | fair | awned |
| Nomini | fair | good | good | poor | medium | fair | awned |
| Starling | fair | fair | good | — | medium | fair | awnless |
Small Grains Updates
Variety Releases
Dr. J. W. Johnson, Department of Crop and Soil Sciences
Georgia Station, Griffin, GA 30223-1797
The Small Grains Breeding Program released a wheat cultivar which will be marketed as AGS 2000 (PVP applied for). AGS 2000 is medium maturing, awned, white chaffed, medium tall soft red winter wheat. It is resistant to currently predominant races of powdery mildew, moderately resistant to leaf rust, and resistant to the predominant biotypes of Hessian Fly in the Southeast. It has a heavy wax on the plants at heading which gives it a distinctive grayish blue-green plant color. This new cultivar available for the first time for the Fall 2000 planting season was tested experimentally as 89482E7. It has the following pedigree: Pioneer 2555 /PF84301 //Florida 302. AGS 2000 is broadly adapted and is high yielding with a high test weight. It was developed by the University of Georgia/University of Florida small grains breeding program. AGS 2000 will be marketed by AGSouth Genetics, a new marketing company created to market selected new varieties developed by both Universities.
The team has also released a new oat cultivar, Horizon 314 (PVP applied for). Horizon 314 (tested as FL92OHR31,314 and FLX499-1-B3-G6) is a new full season winter oat cultivar that has considerable potential for both grain and forage production in the Southeast. It was developed by the University of Florida and the University of Georgia. In comparison to Chapman it is higher yielding, has a heavier test weight, and is 3-6 days later in heading and 4 inches taller in height. It has good winter hardiness, good crown rust resistance, tillers well, and has a dark green plant color. At heading the flag leaves are more upright than most other varieties. Seed are white similar to Chapman and turn greyish if weathered. Horizon 314 has been released exclusively to Plantation Seeds, Newton, Georgia for marketing and promotion and is available for the first time in the Fall of 2000.
Several wheat cultivars have been released by private companies for production in Georgia. These include: FFR 518, Pioneer 26R61, and USG 3209.
Metribuzin Sensitivity*
D. C. Bridges, J. L. Day, J. W. Johnson, and P. L. Raymer
Department of Crop and Soil Sciences, Georgia Station, Griffin, GA 30223-1797
*NOTE: A metribuzin sensitivity field trial was conducted during this small grain growing season (1999-2000). Extremely dry soil at planting caused uneven emergence of wheat and variation within varieties from application of metribuzin. Therefore, the data will not be included in this report. The experiment will be repeated this fall for the 2000-01 growing season. The following information and data are from the 1998-99 field trial.
In recent years Georgia wheat farmers have increasingly experienced difficulties controlling Italian (annual) ryegrass in wheat with Hoelon (diclofop). An option is to use Sencor (metribuzin) as a postemergence treatment for control of annual ryegrass, wild radish, and other broadleaf species. Approximately 10 years ago metribuzin use among Georgia wheat growers was fairly common, but use had declined over the intervening years. However, the current difficulties in controlling ryegrass with Hoelon have spurred interest in once again using Sencor.
Some wheat cultivars are sensitive to Sencor (metribuzin). If Sencor is applied to sensitive cultivars severe injury and/or stand loss may occur. The Sencor label contains a list of known tolerant and sensitive wheat and barley cultivars. However, the label does not contain all varieties that are currently grown in Georgia. Until about 10 years ago, field experiments were routinely conducted to determine cultivar sensitivity to metribuzin. Due to the increased interest in using metribuzin for winter wheat weed control we resumed cultivar evaluations using metribuzin during the 1997-98 wheat season and conducted trials again during the 1998-99 season.
The following table summarizes data collected in a field trial at Griffin, Georgia, during the 1998/99 growing season. Wheat was seeded 13 November 1998 at a seeding rate of 2 bu/acre. Paired treated and untreated plots were included in each of four replicates. Metribuzin (Sencor) was applied postemergence at a rate of 0.375 lb ai/acre to wheat in the 2-3 leaf stage on 4 December 1998. Wheat injury was visually estimated on 14 January 1999 and yields were determined in June 1999.
| Wheat variety response to Sencor (metribuzin) herbicide, Griffin, GA 1998-99. | ||||||
| Cultivar | Wheat Injury (%) |
Yield | Sensitivity Classification1 | |||
| Untreated Weed-free (bu/acre) |
Treated Weed-free (bu/acre) |
Yield Difference2 | UGA Tests | Sencor Label | ||
| AgriPro D93*7163 | 10 | 56 | 56 | NS | T | NOL |
| AgriPro Hickory | 5 | 57 | 51 | NS | T | MT |
| AgriPro Mason | 2.5 | 66 | 60 | NS | T | T |
| AgriPro Patton | 0 | 65 | 60 | NS | T | T |
| AgriPro Shelby | 0 | 61 | 60 | NS | T | T |
| Delta King 1551W | 5 | 52 | 48 | NS | T | NOL |
| Jackson | 2.5 | 60 | 57 | NS | T | T |
| Terral LA 422 | 5 | 65 | 62 | NS | T | NOL |
| NK Coker 9134 | 5 | 71 | 63 | NS | T | T |
| NK Coker 9704 | 5 | 54 | 51 | NS | T3 | S3 |
| NK Coker 9803 | 5 | 57 | 48 | NS | T | M T |
| Pioneer 2684 | 2.5 | 58 | 55 | NS | T | T |
| Pioneer 26R46 | 2.5 | 66 | 66 | NS | T | NOL |
| Pioneer 26R61 | 2.5 | 69 | 68 | NS | T | NOL |
| Pocahontas | 5 | 59 | 50 | NS | T | T |
| UGA88622E51 | 10 | 59 | 54 | NS | T | NOL |
| UGA89482E7 | 2.5 | 74 | 70 | NS | T | NOL |
| Fleming | 12.5 | 63 | 52 | NS | MT | S |
| Pioneer 2643 | 15 | 65 | 45 | S | MT3 | NOL |
| Roberts | 12.5 | 66 | 57 | NS | MT | NOL |
| UGA881178E53 | 12.5 | 66 | 56 | NS | MT | NOL |
| Clemson 201 | 57.5 | 62 | 36 | S | S | NOL |
| FL8868 | 32.5 | 66 | 47 | S | S | NOL |
| GA-Dozier | 68.5 | 51 | 24 | S | S | S |
| GA-Gore | 27.5 | 66 | 52 | S | S | S |
| GA-Stuckey | 80 | 55 | 26 | S | S | S |
| Jaypee | 55 | 60 | 26 | S | S | S |
| Morey | 70 | 63 | 18 | S | S | S |
| NK BL931167 | 32.5 | 52 | 32 | S | S | NOL |
| NK Coker 9663 | 50 | 74 | 43 | S | S | NOL |
| NK Coker 9835 | 30 | 63 | 44 | S | S | S |
| Pioneer 2691 | 22.5 | 61 | 44 | S | S | NOL |
| Roane | 20 | 52 | 44 | NS | S | NOL |
| UGA881428LE2 | 50 | 67 | 43 | S | S | NOL |
| UGA901146E15 | 72.5 | 67 | 23 | S | S | NOL |
| UGA90524E35 | 42.5 | 70 | 43 | S | S | NOL |
| USG 3209 | 55 | 50 | 21 | S | S | NOL |
| 1 Sensitivity Classification: T = Tolerant (UGA studies indicated 10% or less visual injury and no stand loss); MT = Moderately Tolerant (UGA studies indicated visual injury from 11 to 20% with no stand loss); S = Sensitive (UGA studies indicated greater than 20% visual injury and/or stand loss); and NOL = not on label. 2 Where yield differences are marked with “S”, differences between Sencor-treated plots and untreated plots were significantly different at the 10% probability level. For varieties marked “NS”, yields were not significantly different. 3 NK Coker 9704 scored a rating of “Tolerant” in UGA tests. However, it is rated as “Sensitive” on the Sencor label, which indicates that in at least one trial severe injury and/or stand loss was observed with the cultivar. Therefore, NK Coker 9704 should be regarded as “Sensitive”. Pioneer 2643 was initially rated as “Moderately Tolerant” based on early-season visual injury, but based on yields it should be regarded as “Sensitive”. |
||||||
Diseases
Barry M. Cunfer, Department of Plant Pathology
Griffin Campus, Griffin, GA 30223
The dry spring was not conducive for development of foliar diseases. The low level of disease contributed to high yields and grain test weights across the state. However, some losses were encountered on cultivars susceptible to leaf rust. Stagonospora leaf and glume blotch were very low. Symptoms were mostly confined to the lower leaves and very little glume blotch occurred. The most serious disease occurrence was on one farm where over 200 acres were lost because of common bunt or stinking smut. This disease produces a foul odor like dead fish. Spores of the fungus carried on seed invade the seedling when the seed germinates. No damage is seen until heads emerge when the seeds are entirely replaced by smut spores. The smut spores are released during threshing and adhere to the healthy seed. Because so many spores are produced, an infection level near 1 percent one season can result in 50 percent or greater loss the next season. Therefore, the disease may go unnoticed the year before serious loss occurs. Loose smut on oats has a similar life cycle. Loose smut of wheat and barley has a somewhat different life cycle but it is also transmitted only by seed. Smut diseases are very easily controlled by systemic seed treatments. Tebuconazole (Raxil) and difenoconazole (Dividend) are most effective but carboxin (Vitavax) will also give effective control in most cases. Seed protectant fungicides such as captan and thiram will not control smut diseases. Certified seed is inspected for smut diseases and only a very low level is tolerated. Therefore, planting Certified seed is an effective way to control smuts.
Barley yellow dwarf was variable and caused mostly light damage. Take-all root rot caused significant losses in fields with three years of consecutive wheat-soybean doublecropping. Rotation with fallow, oats or canola in place of wheat controls take-all. Wheat should not be grown more than two consecutive years in the same field. Stripe rust was found at very low levels at two locations in the state. The disease was found in several locations in the eastern United States for the first time. The cool spring was favorable for the disease which caused losses in the Mississippi Valley. Stripe rust is unlikely to become a problem in the Southeast.
Insects
G. David Buntin, Department of Entomology, Griffin, Georgia
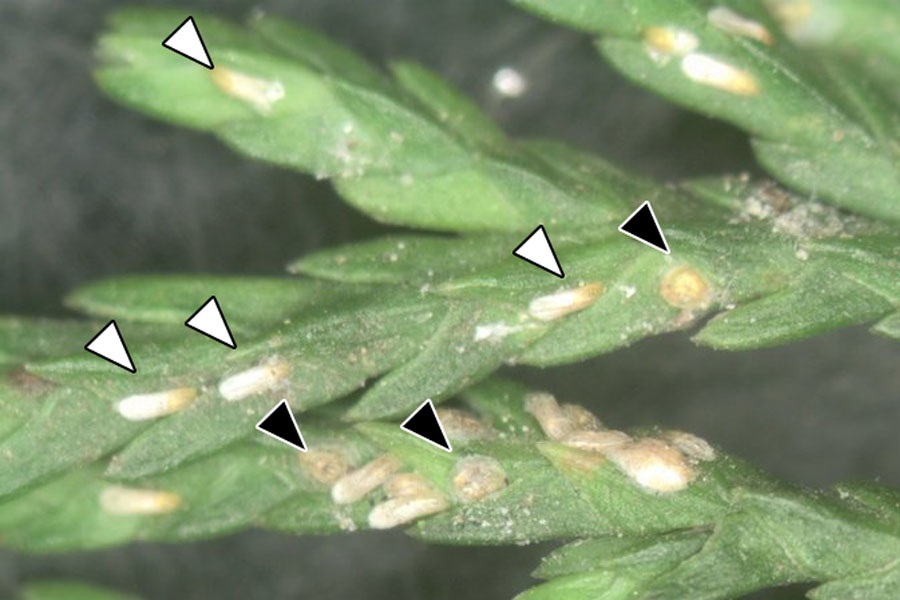
Relatively mild weather during the winter encouraged damaging insect populations to develop in small grains. The Hessian fly, Mayetiola destructor, can cause extensive damage to winter wheat, triticale and barley. Most wheat fields were planted with a resistant variety, and some fields were treated with an at-planting application of insecticide. Hessian fly infestations reached damaging levels in some areas in the southern part of the state. A new Hessian fly biotype (biotype L) is established in northern Georgia and is present in low numbers in southern Georgia. Biotype L can overcome virtually all the Hessian fly resistant varieties currently grown in the state. Varieties showing good levels of Hessian fly resistance at Plains and Griffin in 1999/2000 were ‘AGS 2000,’ ‘NK Coker 9835,’ ‘Croplan SR218,’ ‘FFR 516,’ ‘Pioneer 26R24,’ ‘Pioneer 26R61,’ ‘Roane,’ and ‘Roberts.’ ‘Santee’ was resistant at Plains but susceptible at the Griffin site. ‘AgriPro Hickory,’ ‘Pioneer 2684,’ and ‘Fleming’ had moderate or intermediate levels of resistance at both sites. Although rated as resistant in past years, significant infestations occurred in ‘Pioneer 2684’ in 1999-2000 indicating that this variety has only moderate level of resistance which is not effective under high levels of Hessian fly pressure. Both rye and oats are good Hessian-fly resistant alternatives to wheat for forage production, because rye is highly resistant and oats are immune to the insect.
The mild winter and dry spring encouraged large populations of aphids to develop throughout the state. Aphids caused direct feeding injury to small grains during head emergence and grain fill. Aphids also transmit barley yellow dwarf virus (BYDV) which can cause large yield reductions in wheat, oats, barley and triticale. BYDV symptoms were present in low to moderate levels throughout the state and the disease caused considerable damage to wheat in some areas this season. Although the level of expression of symptoms varies between varieties, no varieties are truly resistant or tolerant of BYDV infection. Systemic insecticide seed treatments and properly timed foliar applications of insecticides can greatly reduce aphid numbers and minimize BYDV incidence.
The cereal leaf beetle now is established throughout northern and most of southern Georgia. Populations continue to increase and caused noticeable damage this year in the Coastal Plain region. Larvae and adults are present in the spring during grain filling where they remove the upper leaf surface and chew elongated holes in leaves. Populations in most areas still are below the treatment threshold of 0.5 larva or adult per stalk. However, damage was very evident in the northwestern and central Piedmont regions of the state with some fields needing treatment with an insecticide. Cereal leaf beetle can be effectively controlled by a number of insecticides when applied to active larvae. Consult your local county extension agent for a list of recommended insecticides for this insect and for management practices for other insect pests of small grains.
| Hessian fly infestations in entries of the Georgia State Winter Wheat Variety Trial at Plains, GA, in 1999-2000. |
|||
| Entry | Resistance rating1 | % infested plants | HF immature per plant |
| Jackson | S | 88.8 * | 5.03 * |
| Croplan SR204 | S | 87.6 * | 4.20 * |
| AR 656-5 | S | 84.8 * | 2.62 * |
| FFR 522 | S | 80.6 * | 3.31 * |
| FFR 518R | S | 78.8 * | 1.89 * |
| Madison | S | 77.7 * | 4.93 * |
| Jaypee | S | 73.0 * | 2.56 * |
| APD 95-7763 | S | 70.8 * | 3.39 * |
| LA 9070G45 | S | 67.3 * | 2.20 * |
| Patton | S | 67.3 * | 2.23 * |
| NK Coker 9663 | S | 66.7 * | 2.56 * |
| FFR 2704 | S | 63.0 * | 2.20 * |
| GA 93132E6 | S | 63.2 * | 2.37 * |
| FFR 566 | S | 62.6 * | 2.01 * |
| NK Coker 9803 | S | 61.9 * | 2.34 * |
| Pioneer 2691 | S | 61.8 * | 1.46 * |
| VA 96W-158 | S | 58.3 * | 2.49 * |
| GA 911316E46 | S | 55.5 * | 1.38 * |
| LA 8983B14 | S | 55.1 * | 1.85 * |
| NK Coker 9704 | S | 51.2 * | 1.56 * |
| GA 901146E15 | S | 43.0 * | 1.64 * |
| USG 3209 | S | 40.0 * | 1.17 |
| AR 584A3 | S | 30.1 * | 1.06 |
| Terral 422 | S | 28.0 * | 0.59 |
| Pioneer 2684 | MR | 26.0 * | 0.84 |
| VA 96W-270 | MR | 21.2 | 0.48 |
| AgriPro Hickory | MR | 19.4 | 0.83 |
| LA 90144B16 | MR | 18.4 | 0.36 |
| Fleming | MR | 18.0 | 0.45 |
| GA 91436E29 | MR | 17.8 | 0.44 |
| GA 921188E43 | R | 17.1 | 0.25 |
| GA93059LE6 | R | 15.2 | 0.29 |
| Roane | R | 14.6 | 0.33 |
| GA 92485E15 | MR | 12.2 | 0.37 |
| BL 930026 | R | 10.9 | 0.26 |
| GA 921204E44 | R | 10.8 | 0.17 |
| AGS 2000 | R | 10.4 | 0.30 |
| Croplan SR218 | R | 9.0 | 0.20 |
| GA 921221E16 | R | 7.8 | 0.16 |
| GA 90524E1 | R | 7.2 | 0.22 |
| FFR 516 | R | 4.6 | 0.13 |
| Roberts | R | 3.4 | 0.03 |
| GA 91426E39 | R | 3.3 | 0.10 |
| Santee | R | 2.3 | 0.07 |
| GA 92412LE16 | R | 1.5 | 0.02 |
| Pioneer 26R24 | R | 1.3 | 0.03 |
| NK Coker 9835 | R | 1.1 | 0.03 |
| PXW682 | R | 0.8 | 0.01 |
| GA 921206E38 | R | 0.6 | 0.01 |
| Pioneer 26R61 | R | 0 | 0 |
| GA 90524E35 | R | 0 | 0 |
| AR 494B2 | R | 0 | 0 |
| GA 92601LE9 | R | 0 | 0 |
| LA 90518TB43 | R | 0 | 0 |
| LSD (0.05) | 21.9 | 1.29 | |
| LSD (0.1) | 18.3 | 1.08 | |
| 1 S = susceptible, MR = moderate, R = resistant. * Indicates mean is significantly greater than zero (P<0.05; LSD test). Entry means average of 3 replications, RCBD. |
|||
| Hessian fly infestations in entries of the Georgia State Winter Wheat Variety Trial at Griffin, GA, in 1999-2000. |
|||
| Entry | Resistance rating1 | % infested plants | HF immature per plant |
| Jackson | S | 84.4 | 2.57 |
| NK Coker 9803 | S | 82.2 | 2.72 |
| GA 93132E6 | S | 81.1 | 2.27 |
| AR 656-5 | S | 81.1 | 2.04 |
| NK Coker 9704 | S | 77.8 | 2.64 |
| FFR 518R | S | 75.6 | 2.58 |
| FFR 2704 | S | 74.4 | 2.58 |
| LA 9070G45 | S | 72.2 | 2.30 |
| GA 921204E44 | S | 72.2 | 1.80 |
| FFR 566 | S | 71.1 | 2.24 |
| Jaypee | S | 71.1 | 2.21 |
| AR 494B2 | S | 70.0 | 2.18 |
| Santee | S | 67.8 | 1.86 |
| APD 95-7763 | S | 66.7 | 2.00 |
| GA 92412LE16 | S | 66.7 | 1.48 |
| LA 90518TB43 | S | 64.4 | 1.54 |
| LA 8983B14 | S | 63.3 | 1.54 |
| NK Coker 9663 | S | 58.9 | 1.57 |
| Madison | S | 58.9 | 1.44 |
| GA 911316E46 | S | 57.8 | 1.56 |
| Croplan SR204 | S | 55.6 | 1.70 |
| FFR 522 | S | 55.4 | 1.84 |
| GA 901146E15 | S | 53.3 | 1.51 |
| Patton | S | 52.2 | 1.36 |
| AR 584A3 | S | 44.4 | 1.01 |
| GA 93059LE6 | S | 42.2 | 1.08 |
| VA 96W-270 | S | 37.8 * | 1.09 * |
| VA 96W-158 | S | 37.8 * | 1.00 * |
| Pioneer 2691 | S | 36.7 * | 0.86 * |
| GA 90524E35 | S | 36.7 * | 0.96 * |
| Terral 422 | S | 33.3 * | 0.72 * |
| GA 93601LE9 | S | 33.3 * | 0.67 * |
| NK Coker 9835 | S | 33.3 * | 0.56 * |
| GA 921206E38 | S | 30.0 * | 0.63 * |
| USG 3209 | S | 26.7 * | 0.76 * |
| GA 91436E29 | MR | 26.7 * | 0.60 |
| Pioneer 26R24 | MR | 26.7 * | 0.56 |
| GA 921188E43 | MR | 26.7 * | 0.52 |
| Fleming | MR | 24.4 * | 0.52 |
| GA 92485E15 | MR | 21.2 * | 0.47 |
| Pioneer 2684 | MR | 20.0 * | 0.39 |
| AgriPro Hickory | MR | 17.1 | 0.46 |
| BL 940026 | R | 16.7 | 0.40 |
| GA 91426E39 | R | 13.3 | 0.44 |
| AGS 2000 | R | 11.1 | 0.31 |
| Roberts | R | 11.1 | 0.28 |
| LA 90144B16 | R | 10.0 | 0.14 |
| GA 90524E1 | R | 8.9 | 0.17 |
| Croplan SR218 | R | 8.9 | 0.21 |
| GA 921221E16 | R | 6.7 | 0.18 |
| Roane | R | 5.6 | 0.14 |
| PXW 682 | R | 2.2 | 0.04 |
| FFR 516 | R | 2.2 | 0.03 |
| Pioneer 26R61 | R | 0 | 0 |
| LSD (0.05) | 19.6 | 0.74 | |
| LSD (0.1) | 16.4 | 0.62 | |
| 1 S = susceptible, MR = moderate resistant, R = resistant. * Mean is significantly greater than zero (P<0.05; LSD test). Entry means average of 3 replications, RCBD. |
|||
Grain Test Results
Wheat — Grain
State Variety Trials
| Wheat Grain Performance, 1999-2000 Tifton, Georgia |
||||||||||
| Brand-Variety | Yield1 | 2000 Data | ||||||||
| 3-Year Avg. | 2-Year Avg. | Rank | Yield | Test Wt | Ht | Lodg. | Winter Survival | Head Date | Leaf Rust2 4/26 | |
| — bu/ acre — |
bu/ acre |
lb/ bu |
in | % | % | mo/ day |
% | |||
| AGS 2000 | 65.5 | 65.1 | 8 | 74.6 | 60.7 | 44 | 11 | 100 | 03/26 | 1 |
| UGA90524E35 | 61.9 | 63.7 | 5 | 75.9 | 57.3 | 36 | 10 | 100 | 03/25 | 45 |
| Pioneer 26R61 | 61.3 | 63.4 | 9 | 73.1 | 60.4 | 44 | 0 | 100 | 03/29 | 0 |
| Pioneer 2684 | 60.0 | 62.0 | 20 | 69.5 | 60.4 | 40 | 0 | 100 | 03/29 | 20 |
| NK Coker 9835 | 59.9 | 58.5 | 22 | 67.9 | 56.0 | 35 | 1 | 100 | 03/27 | 100 |
| Jaypee | 56.3 | 59.2 | 13 | 70.9 | 60.6 | 41 | 8 | 100 | 03/27 | 0 |
| Roberts | 52.3 | 56.0 | 6 | 75.7 | 59.6 | 41 | 10 | 100 | 04/02 | 10 |
| Jackson | 46.9 | 47.0 | 19 | 69.7 | 59.5 | 42 | 0 | 100 | 04/05 | 70 |
| Roane | 40.0 | 42.2 | 33 | 55.4 | 58.5 | 35 | 0 | 100 | 04/12 | 15 |
| Pioneer XW682 | . | . | 1 | 81.3 | 59.7 | 43 | 1 | 100 | 03/27 | 0 |
| LA9070G45-3-3-1 | . | . | 2 | 80.6 | 57.0 | 41 | 0 | 100 | 03/28 | 42 |
| VA96W-158 | . | . | 3 | 79.6 | 58.0 | 41 | 0 | 100 | 03/31 | 30 |
| Pioneer 26R24 | . | . | 4 | 77.5 | 59.1 | 43 | 10 | 100 | 04/01 | 70 |
| GA93132E6 | . | . | 7 | 75.0 | 60.0 | 43 | 29 | 100 | 03/28 | 5 |
| GA90524E1 | . | . | 10 | 73.0 | 59.5 | 37 | 1 | 100 | 03/26 | 5 |
| UGA 911316E46 | . | 59.0 | 11 | 72.1 | 59.1 | 39 | 21 | 100 | 04/02 | 0 |
| GA921188E43 | . | . | 12 | 71.0 | 58.6 | 43 | 1 | 100 | 03/27 | 0 |
| VA96W-270 | . | . | 14 | 70.4 | 59.5 | 40 | 0 | 100 | 03/31 | 10 |
| UGA 92485-E15 | . | 63.6 | 15 | 70.2 | 61.2 | 42 | 0 | 100 | 03/27 | 15 |
| LA8983B14-3-1-2 | . | . | 16 | 70.1 | 58.4 | 38 | 3 | 100 | 03/25 | 70 |
| GA921204E44 | . | . | 17 | 69.9 | 58.3 | 43 | 20 | 100 | 03/24 | 0 |
| LA90518PB43-3-1-4 | . | . | 18 | 69.9 | 58.8 | 43 | 0 | 100 | 03/28 | 0 |
| AR 494B-2-2 | . | . | 21 | 69.2 | 59.0 | 42 | 26 | 100 | 03/31 | 60 |
| AR656-5-1 | . | . | 23 | 67.5 | 57.1 | 44 | 0 | 100 | 04/03 | 45 |
| AgriPro D95-7763 | . | . | 24 | 67.4 | 57.8 | 43 | 5 | 100 | 04/06 | 0 |
| GA921206E38 | . | . | 25 | 67.1 | 59.2 | 40 | 3 | 100 | 03/26 | 7 |
| LA90144B16-3-2 | . | . | 26 | 66.5 | 58.3 | 37 | 1 | 100 | 03/25 | 100 |
| AgriPro BL94-0026 | . | . | 27 | 66.1 | 55.6 | 41 | 5 | 100 | 03/27 | 35 |
| GA921221E16 | . | . | 28 | 65.3 | 60.2 | 42 | 1 | 100 | 03/24 | 30 |
| UGA 91436E29 | . | 50.8 | 29 | 58.1 | 58.2 | 40 | 1 | 100 | 04/05 | 65 |
| Croplan SR204 | . | . | 30 | 57.8 | 60.0 | 44 | 5 | 100 | 04/09 | 18 |
| AR 584A-3-1 | . | . | 31 | 57.0 | 57.6 | 44 | 1 | 100 | 04/09 | 0 |
| Croplan SR218 | . | . | 32 | 56.6 | 57.6 | 44 | 0 | 100 | 04/11 | 16 |
| Average | 56.0 | 57.5 | 69.43 | 58.8 | 41 | 5 | 100 | 03/30 | 27 | |
| LSD at 10% Level | 3.5 | N.S.4 | 7.4 | 1.5 | 2 | 13 | – | 01 | – | |
| Std. Err. of Entry Mean | 1.4 | 1.9 | 3.2 | 0.6 | 1 | 6 | – | 01 | – | |
| 1 Yields calculated as 60 pounds per bushel at 13.5% moisture. 2 Percentage on flag leaves. 3 C.V. = 9.1%, and df for EMS = 96. 4 The F-test indicated no statistical difference at the alpha = 0.1 probability level; therefore, an LSD value was not calculated. Bolding indicates entries yielding equal to highest yielding entry within a column based on Fisher’s protected LSD (P = 0.10). |
||||||||||
| Planted: | November 16, 1999. | |||||||||
| Harvested: | May 30, 2000. | |||||||||
| Seeding Rate: | 22 seeds per foot in 7″ rows. | |||||||||
| Soil Type: | Tifton loamy sand. | |||||||||
| Soil Test: | P = High, K = Medium, and pH = 5.7. | |||||||||
| Fertilization: | Preplant: 40 lb N, 40 lb P2O5, and 40 lb K2O/acre. Topdress: 40 lb N/acre. |
|||||||||
| Management: | Moldboard plowed and rototilled. | |||||||||
| Previous Crop: | Cotton. | |||||||||
| Test conducted by A. E. Coy and M. D. Pippin. | ||||||||||
| Wheat Grain Performance with Foliar Fungicide, 1999-2000 Tifton, Georgia |
|||||||
| Brand—Variety | Yield1 (bu/acre) |
Test Wt (lb/bu) |
Ht (in) |
Lodg. (%) |
Winter Survival (%) |
Head Date (mo/day) |
Leaf Rust2 4/26 (%) |
| NK Coker 9835 | 84.5 | 57.4 | 37 | 5 | 100 | 03/25 | 20 |
| Pioneer XW682 | 83.4 | 59.1 | 45 | 0 | 100 | 03/25 | 0 |
| AGS 2000 | 82.7 | 61.2 | 43 | 6 | 100 | 03/25 | 0 |
| VA96W—158 | 82.6 | 58.4 | 43 | 0 | 100 | 03/31 | 0 |
| UGA 92485—E15 | 81.5 | 61.4 | 44 | 3 | 100 | 03/23 | 0 |
| Roberts | 80.7 | 59.9 | 43 | 1 | 100 | 04/03 | 0 |
| Pioneer 26R24 | 80.1 | 60.4 | 44 | 1 | 100 | 03/31 | 20 |
| Jackson | 77.5 | 59.2 | 44 | 1 | 100 | 04/06 | 0 |
| AgriPro D95—7763 | 77.0 | 58.3 | 43 | 0 | 100 | 04/07 | 0 |
| LA90144B16—3—2 | 76.9 | 59.0 | 37 | 0 | 100 | 03/25 | 10 |
| Pioneer 2684 | 76.9 | 60.9 | 42 | 0 | 100 | 03/28 | 0 |
| GA90524E1 | 76.7 | 59.1 | 39 | 6 | 100 | 03/26 | 0 |
| LA9070G45—3—3—1 | 76.4 | 57.1 | 40 | 0 | 100 | 03/26 | 0 |
| UGA 911316E46 | 75.7 | 59.9 | 38 | 20 | 100 | 03/31 | 0 |
| LA90518PB43—3—1—4 | 75.6 | 58.4 | 43 | 0 | 100 | 03/27 | 0 |
| GA921221E16 | 75.4 | 56.9 | 42 | 1 | 100 | 03/24 | 0 |
| Jaypee | 75.2 | 60.0 | 39 | 6 | 100 | 03/27 | 0 |
| GA93132E6 | 75.2 | 59.8 | 44 | 21 | 100 | 03/27 | 0 |
| UGA90524E35 | 73.7 | 57.5 | 36 | 48 | 100 | 03/24 | 0 |
| GA921188E43 | 73.4 | 58.8 | 43 | 4 | 100 | 03/26 | 0 |
| UGA 91436E29 | 72.3 | 59.1 | 40 | 0 | 100 | 04/05 | 10 |
| AR656—5—1 | 72.0 | 58.2 | 45 | 0 | 100 | 04/04 | 0 |
| LA8983B14—3—1—2 | 71.9 | 56.9 | 38 | 1 | 100 | 03/25 | 0 |
| AR 494B—2—2 | 71.7 | 59.5 | 43 | 13 | 100 | 03/29 | 0 |
| Pioneer 26R61 | 70.7 | 60.4 | 44 | 0 | 100 | 03/28 | 0 |
| AgriPro BL94—0026 | 70.7 | 55.5 | 41 | 0 | 100 | 03/26 | 0 |
| VA96W—270 | 69.8 | 58.0 | 40 | 0 | 100 | 03/30 | 0 |
| GA921206E38 | 69.2 | 58.9 | 39 | 4 | 100 | 03/26 | 0 |
| GA921204E44 | 68.4 | 57.5 | 43 | 9 | 100 | 03/24 | 0 |
| Croplan SR204 | 66.4 | 59.8 | 44 | 0 | 100 | 04/10 | 0 |
| AR 584A—3—1 | 65.5 | 58.8 | 45 | 1 | 100 | 04/08 | 0 |
| Croplan SR218 | 60.9 | 58.1 | 45 | 0 | 100 | 04/11 | 0 |
| Roane | 60.8 | 60.0 | 39 | 0 | 100 | 04/12 | 0 |
| Average | 74.33 | 58.9 | 41 | 5 | 100 | 03/30 | 2 |
| LSD at 10% Level | 5.4 | 1.0 | 2 | 11 | — | 01 | — |
| Std. Err. of Entry Mean | 2.3 | 0.4 | 1 | 4 | — | 01 | — |
| 1 Yields calculated as 60 pounds per bushel at 13.5% moisture. 2 Percentage on flag leaves. 3 C.V. = 6.2%, and df for EMS = 96. Bolding indicates entries yielding equal to highest yielding entry within a column based on Fisher’s protected LSD (P = 0.10). |
|||||||
| Planted: | November 16, 1999. | ||||||
| Harvested: | May 30, 2000 | ||||||
| Seeding Rate: | 22 seeds per foot in 7″ rows. | ||||||
| Soil Type: | Tifton loamy sand. | ||||||
| Soil Test: | P = High, K = Medium, and pH = 5.7. | ||||||
| Fertilization: | 40 lb N, 40 lb P2O5, and 40 lb K2O/acre. 40 lb N/acre. |
||||||
| Management: | Moldboard plowed and rototilled; 4 oz/acre Bayleton and 4 oz/acre Tilt applied to control fungal diseases. | ||||||
| Previous Crop: | Cotton. | ||||||
| Test conducted by A. E. Coy and M. D. Pippin. | |||||||
| Effect of Fungicide on Wheat Grain Yield, 1999-2000 Tifton, Georgia |
||||
| Brand-Variety | Yield1 | Difference with fungicide | Change with fungicide | |
| no fungicide | fungicide2 | |||
| ———— bu/A ———— | bu/A | % | ||
| Pioneer XW682 | 81.3 | 83.4 | 2.0 | 2.5 |
| LA9070G45-3-3-1 | 80.6 | 76.4 | -4.2 | -5.2 |
| VA96W-158 | 79.6 | 82.6 | 3.0 | 3.8 |
| Pioneer 26R24 | 77.5 | 80.1 | 2.5 | 3.3 |
| UGA90524E35 | 75.9 | 73.7 | -2.2 | -2.9 |
| Roberts | 75.7 | 80.7 | 5.0 | 6.5 |
| GA93132E6 | 75.0 | 75.2 | 0.2 | 0.2 |
| AGS 2000 | 74.6 | 82.7 | 8.2 | 11.0 |
| Pioneer 26R61 | 73.1 | 70.7 | -2.4 | -3.3 |
| GA90524E1 | 73.0 | 76.7 | 3.7 | 5.1 |
| UGA 911316E46 | 72.1 | 75.7 | 3.6 | 5.0 |
| GA921188E43 | 71.0 | 73.4 | 2.4 | 3.4 |
| Jaypee | 70.9 | 75.2 | 4.3 | 6.0 |
| VA96W-270 | 70.4 | 69.8 | -0.5 | -0.8 |
| UGA 92485-E15 | 70.2 | 81.5 | 11.3 | 16.2 |
| LA8983B14-3-1-2 | 70.1 | 71.9 | 1.9 | 2.6 |
| GA921204E44 | 69.9 | 68.4 | -1.5 | -2.1 |
| LA90518PB43-3-1-4 | 69.9 | 75.6 | 5.7 | 8.2 |
| Jackson | 69.7 | 77.5 | 7.8 | 11.2 |
| Pioneer 2684 | 69.5 | 76.9 | 7.3 | 10.5 |
| AR 494B-2-2 | 69.2 | 71.7 | 2.5 | 3.6 |
| NK Coker 9835 | 67.9 | 84.5 | 16.5 | 24.3 |
| AR656-5-1 | 67.5 | 72.0 | 4.6 | 6.7 |
| AgriPro D95-7763 | 67.4 | 77.0 | 9.5 | 14.2 |
| GA921206E38 | 67.1 | 69.2 | 2.0 | 3.1 |
| LA90144B16-3-2 | 66.5 | 76.9 | 10.4 | 15.7 |
| NK BL94-0026 | 66.1 | 70.7 | 4.6 | 6.9 |
| GA921221E16 | 65.3 | 75.4 | 10.1 | 15.5 |
| UGA 91436E29 | 58.1 | 72.3 | 14.2 | 24.4 |
| Croplan SR204 | 57.8 | 66.4 | 8.6 | 14.9 |
| AR 584A-3-1 | 57.0 | 65.5 | 8.6 | 15.1 |
| Croplan SR218 | 56.6 | 60.9 | 4.3 | 7.6 |
| Roane | 55.4 | 60.8 | 5.3 | 9.7 |
| Average | 69.4 | 74.3 | 4.9 | 7.4 |
| LSD at 10% Level | 7.4 | 5.4 | ||
| Std. Err. of Entry Mean | 3.2 | 2.3 | ||
| 1 Yields calculated as 60 pounds per bushel at 13.5% moisture. 2 Fungicide applied to control fungal diseases: 4 oz/acre Bayleton and 4 oz/acre Tilt. Bolding indicates entries yielding equal to highest yielding entry within a column based on Fisher’s protected LSD (P = 0.10). |
||||
| Late-Planted Wheat Grain Performance, 1999-2000 Tifton, Georgia |
|||||||
| Brand-Variety | Yield1 (bu/acre) |
Test Wt (lb/bu) |
Ht (in) |
Lodg. (%) |
Winter Survival (%) |
Head Date (mo/day) |
Leaf Rust2 4/26 (%) |
| Early Maturing Varieties | |||||||
| S St FFR-518-R | 73.0 | 58.7 | 39 | 0 | 100 | 03/28 | 5 |
| UGA901146E15 | 71.1 | 60.1 | 38 | 0 | 100 | 03/29 | 1 |
| UGA 93059LE6 | 70.9 | 60.3 | 40 | 9 | 100 | 03/24 | 0 |
| USG 3209 | 70.7 | 59.7 | 37 | 0 | 100 | 03/31 | 0 |
| Pioneer 2691 | 66.7 | 61.3 | 36 | 0 | 100 | 03/25 | 0 |
| UGA 91426E39 | 66.2 | 61.1 | 41 | 0 | 100 | 03/28 | 1 |
| GA92412LE16 | 66.1 | 63.4 | 39 | 4 | 100 | 03/25 | 10 |
| Fleming | 65.9 | 61.9 | 38 | 0 | 100 | 03/22 | 0 |
| Terral 422 | 64.8 | 60.0 | 40 | 0 | 100 | 03/31 | 0 |
| NK Coker 9663 | 64.5 | 60.8 | 45 | 6 | 100 | 03/29 | 5 |
| GA92601E9 | 63.3 | 61.4 | 40 | 0 | 100 | 03/26 | 0 |
| AgriPro Mason | 58.5 | 60.0 | 39 | 0 | 100 | 03/29 | 0 |
| FFR516 | 57.5 | 60.5 | 39 | 0 | 100 | 04/02 | 0 |
| Average | 66.13 | 60.7 | 39 | 1 | 100 | 03/28 | 2 |
| LSD at 10% Level | 6.2 | 0.9 | 1 | 4 | – | 01 | – |
| Std. Err. of Entry Mean | 2.6 | 0.4 | 1 | 2 | – | 01 | – |
| 1 Yields calculated as 60 pounds per bushel at 13.5% moisture. 2 Percentage on flag leaves. 3 C.V. = 7.8%, and df for EMS = 36. Bolding indicates entries yielding equal to highest yielding entry within a column based on Fisher’s protected LSD (P = 0.10). |
|||||||
| Planted: | November 30, 1999. | ||||||
| Harvested: | May 17, 2000. | ||||||
| Seeding Rate: | 22 seeds per foot in 7″ rows. | ||||||
| Soil Type: | Tifton loamy sand. | ||||||
| Soil Test: | P = High, K = Medium, and pH = 5.7. | ||||||
| Fertilization: | Preplant: 40 lb N, 40 lb P2O5, and 40 lb K2O/acre. Topdress: 40 lb N/acre. |
||||||
| Management: | Moldboard plowed and rototilled. | ||||||
| Previous Crop: | Cotton. | ||||||
| Test conducted by A. E. Coy and M. D. Pippin. | |||||||
| Late-Planted Wheat Grain Performance with Foliar Fungicide, 1999-2000 Tifton, Georgia |
|||||||
| Brand-Variety | Yield1 (bu/acre) |
Test Wt (lb/bu) |
Ht (in) |
Lodg. (%) |
Winter Survival (%) |
Head Date (mo/day) |
Leaf Rust2 4/26 (%) |
| Early Maturing Varieties | |||||||
| USG 3209 | 72.1 | 59.8 | 37 | 0 | 100 | 03/31 | 0 |
| Fleming | 71.6 | 61.6 | 39 | 0 | 100 | 03/22 | 0 |
| UGA 93059LE6 | 70.4 | 60.5 | 39 | 7 | 100 | 03/25 | 0 |
| Terral 422 | 69.9 | 60.1 | 41 | 0 | 100 | 03/31 | 0 |
| S St FFR-518-R | 69.7 | 59.6 | 40 | 1 | 100 | 03/27 | 0 |
| UGA901146E15 | 68.8 | 58.7 | 38 | 0 | 100 | 03/29 | 0 |
| Pioneer 2691 | 68.5 | 61.2 | 38 | 0 | 100 | 03/25 | 0 |
| UGA 91426E39 | 67.4 | 60.7 | 41 | 1 | 100 | 03/27 | 0 |
| GA92601E9 | 67.2 | 61.7 | 41 | 0 | 100 | 03/24 | 0 |
| NK Coker 9663 | 64.4 | 60.3 | 45 | 11 | 100 | 03/29 | 0 |
| AgriPro Mason | 64.1 | 60.3 | 40 | 0 | 100 | 03/28 | 0 |
| GA92412LE16 | 64.1 | 62.7 | 38 | 0 | 100 | 03/26 | 0 |
| FFR516 | 53.6 | 60.1 | 39 | 0 | 100 | 04/02 | 0 |
| Average | 67.13 | 60.5 | 39 | 2 | 100 | 03/27 | 0 |
| LSD at 10% Level | 6.0 | 0.8 | 1 | 3 | – | 01 | – |
| Std. Err. of Entry Mean | 2.5 | 0.3 | 1 | 2 | – | 01 | – |
| 1 Yields calculated as 60 pounds per bushel at 13.5% moisture. 2 Percentage on flag leaves. 3 C.V. = 7.4%, and df for EMS = 36. Bolding indicates entries yielding equal to highest yielding entry within a column based on Fisher’s protected LSD (P = 0.10). |
|||||||
| Planted: | November 30, 1999. | ||||||
| Harvested: | May 17, 2000. | ||||||
| Seeding Rate: | 22 seeds per foot in 7″ rows. | ||||||
| Soil Type: | Tifton loamy sand. | ||||||
| Soil Test: | P = High, K = Medium, and pH = 5.7. | ||||||
| Fertilization: | Preplant: 40 lb N, 40 lb P2O5, and 40 lb K2O/acre. Topdress: 40 lb N/acre. |
||||||
| Management: | Moldboard plowed and rototilled; 4 oz/acre Bayleton and 4 oz/acre Tilt applied to control fungal diseases. | ||||||
| Previous Crop: | Cotton. | ||||||
| Test conducted by A. E. Coy and M. D. Pippin. | |||||||
| Late-Planted Wheat Grain Performance with Foliar Fungicide, 1999-2000 Tifton, Georgia |
|||||||
| Brand-Variety | Yield1 (bu/acre) |
Test Wt (lb/bu) |
Ht (in) |
Lodg. (%) |
Winter Survival (%) |
Head Date (mo/day) |
Leaf Rust2 4/26 (%) |
| Early Maturing Varieties | |||||||
| USG 3209 | 72.1 | 59.8 | 37 | 0 | 100 | 03/31 | 0 |
| Fleming | 71.6 | 61.6 | 39 | 0 | 100 | 03/22 | 0 |
| UGA 93059LE6 | 70.4 | 60.5 | 39 | 7 | 100 | 03/25 | 0 |
| Terral 422 | 69.9 | 60.1 | 41 | 0 | 100 | 03/31 | 0 |
| S St FFR-518-R | 69.7 | 59.6 | 40 | 1 | 100 | 03/27 | 0 |
| UGA901146E15 | 68.8 | 58.7 | 38 | 0 | 100 | 03/29 | 0 |
| Pioneer 2691 | 68.5 | 61.2 | 38 | 0 | 100 | 03/25 | 0 |
| UGA 91426E39 | 67.4 | 60.7 | 41 | 1 | 100 | 03/27 | 0 |
| GA92601E9 | 67.2 | 61.7 | 41 | 0 | 100 | 03/24 | 0 |
| NK Coker 9663 | 64.4 | 60.3 | 45 | 11 | 100 | 03/29 | 0 |
| AgriPro Mason | 64.1 | 60.3 | 40 | 0 | 100 | 03/28 | 0 |
| GA92412LE16 | 64.1 | 62.7 | 38 | 0 | 100 | 03/26 | 0 |
| FFR516 | 53.6 | 60.1 | 39 | 0 | 100 | 04/02 | 0 |
| Average | 67.13 | 60.5 | 39 | 2 | 100 | 03/27 | 0 |
| LSD at 10% Level | 6.0 | 0.8 | 1 | 3 | – | 01 | – |
| Std. Err. of Entry Mean | 2.5 | 0.3 | 1 | 2 | – | 01 | – |
| 1 Yields calculated as 60 pounds per bushel at 13.5% moisture. 2 Percentage on flag leaves. 3 C.V. = 7.4%, and df for EMS = 36. Bolding indicates entries yielding equal to highest yielding entry within a column based on Fisher’s protected LSD (P = 0.10). |
|||||||
| Planted: | November 30, 1999. | ||||||
| Harvested: | May 17, 2000. | ||||||
| Seeding Rate: | 22 seeds per foot in 7″ rows. | ||||||
| Soil Type: | Tifton loamy sand. | ||||||
| Soil Test: | P = High, K = Medium, and pH = 5.7. | ||||||
| Fertilization: | 40 lb N, 40 lb P2O5, and 40 lb K2O/acre. 40 lb N/acre. |
||||||
| Management: | Moldboard plowed and rototilled; 4 oz/acre Bayleton and 4 oz/acre Tilt applied to control fungal diseases. | ||||||
| Previous Crop: | Cotton. | ||||||
| Test conducted by A. E. Coy and M. D. Pippin. | |||||||
| Wheat Grain Performance, 1999-2000 Plains, Georgia |
|||||||||
| Brand-Variety | Yield1 | 2000 Data | |||||||
| 3-Year Avg. | 2-Year Avg. | Rank | Yield(bu/acre) | Test Wt(lb/bu) | Ht (in) |
Lodg.(%) | Winter Survival(%) | Head Date(mo/day) | |
| – bu/acre – | |||||||||
| AGS 2000 | 74.4 | 75.3 | 2 | 83.8 | 61.7 | 42 | 6 | 100 | 03/29 |
| UGA90524E35 | 72.1 | 71.8 | 7 | 78.1 | 58.5 | 37 | 23 | 100 | 03/27 |
| Pioneer 26R61 | 70.8 | 74.9 | 3 | 83.5 | 62.5 | 45 | 0 | 100 | 03/31 |
| Pioneer 2684 | 69.8 | 72.5 | 6 | 78.3 | 62.6 | 40 | 0 | 100 | 03/31 |
| NK Coker 9835 | 64.8 | 69.5 | 8 | 77.8 | 59.9 | 35 | 0 | 100 | 03/29 |
| Roberts | 61.2 | 62.0 | 14 | 74.8 | 60.1 | 41 | 8 | 100 | 04/02 |
| Jaypee | 60.5 | 56.9 | 25 | 67.7 | 61.7 | 39 | 6 | 100 | 03/29 |
| Jackson | 46.8 | 41.8 | 32 | 58.3 | 58.7 | 41 | 6 | 100 | 04/03 |
| Roane | 45.0 | 41.3 | 30 | 59.6 | 60.7 | 38 | 0 | 100 | . |
| Pioneer XW682 | . | . | 1 | 86.7 | 61.6 | 43 | 0 | 100 | 03/28 |
| Pioneer 26R24 | . | . | 4 | 82.6 | 61.1 | 43 | 0 | 100 | 04/02 |
| GA90524E1 | . | . | 5 | 81.3 | 62.1 | 38 | 2 | 100 | 03/29 |
| VA96W-270 | . | . | 9 | 77.2 | 60.9 | 41 | 0 | 100 | 03/31 |
| LA90144B16-3-2 | . | . | 10 | 76.9 | 61.3 | 38 | 0 | 100 | 03/28 |
| GA921221E16 | . | . | 11 | 76.8 | 60.1 | 42 | 3 | 100 | 03/27 |
| GA921188E43 | . | . | 12 | 75.2 | 60.6 | 42 | 3 | 100 | 03/28 |
| VA96W-158 | . | . | 13 | 75.1 | 60.0 | 42 | 0 | 100 | 03/31 |
| LA8983B14-3-1-2 | . | . | 15 | 73.4 | 59.5 | 38 | 3 | 100 | 03/29 |
| GA93132E6 | . | . | 16 | 72.5 | 62.1 | 42 | 14 | 100 | 03/30 |
| LA9070G45-3-3-1 | . | . | 17 | 71.8 | 59.2 | 39 | 5 | 100 | 03/31 |
| LA90518PB43-3-1-4 | . | . | 18 | 71.7 | 59.4 | 42 | 1 | 100 | 03/29 |
| AgriPro BL94-0026 | . | . | 19 | 70.7 | 58.2 | 41 | 0 | 100 | 03/29 |
| UGA 92485-E15 | . | 65.0 | 20 | 70.4 | 63.2 | 42 | 1 | 100 | 03/29 |
| AR 494B-2-2 | . | . | 21 | 69.7 | 60.5 | 42 | 20 | 100 | 03/31 |
| GA921206E38 | . | . | 22 | 69.7 | 60.6 | 39 | 24 | 100 | 03/28 |
| UGA 91436E29 | . | 58.9 | 23 | 69.3 | 60.4 | 39 | 0 | 100 | 04/04 |
| GA921204E44 | . | . | 24 | 68.3 | 59.9 | 43 | 21 | 100 | 03/27 |
| AgriPro D95-7763 | . | . | 26 | 66.5 | 62.8 | 42 | 8 | 100 | 04/02 |
| UGA 911316E46 | . | 59.5 | 27 | 65.5 | 60.6 | 36 | 23 | 100 | 04/01 |
| AR 584A-3-1 | . | . | 28 | 62.3 | 60.5 | 43 | 4 | 100 | 04/04 |
| Croplan SR218 | . | . | 29 | 60.8 | 59.8 | 42 | 0 | 100 | . |
| AR656-5-1 | . | . | 31 | 59.5 | 58.2 | 42 | 3 | 100 | 04/03 |
| Croplan SR204 | . | . | 33 | 46.9 | 59.2 | 40 | 5 | 100 | 04/05 |
| Average | 62.8 | 62.5 | 71.62 | 60.5 | 40 | 6 | 100 | 03/30 | |
| LSD at 10% Level | 3.2 | 4.3 | 4.8 | 1.6 | 2 | 9 | – | 01 | |
| Std. Err. of Entry Mean | 1.4 | 1.8 | 2.0 | 0.7 | 1 | 4 | – | 01 | |
| 1 Yields calculated as 60 pounds per bushel at 13.5% moisture. 2 C.V. = 5.8%, and df for EMS = 96. 3 The F-test indicated no statistical difference at the alpha = 0.1 probability level; therefore, an LSD value was not calculated. Bolding indicates entries yielding equal to highest yielding entry within a column based on Fisher’s protected LSD (P = 0.10). |
|||||||||
| Planted: | November 15, 1999. | ||||||||
| Harvested: | May 23, 2000. | ||||||||
| Seeding Rate: | 22 seeds per foot in 7″ rows. | ||||||||
| Soil Type: | Greenville sandy clay loam. | ||||||||
| Soil Test: | P = High, K = High, and pH = 6.2. | ||||||||
| Fertilization: | 9 lb N, 54 lb P2O5, and 27 lb K2O/acre. 60 lb N/acre. |
||||||||
| Management: | Subsoiled and rototilled. | ||||||||
| Previous Crop: | Peanut. | ||||||||
| Test conducted by A. E. Coy, M. D. Pippin, and R. R. Pines. | |||||||||
| Late-Planted Wheat Grain Performance, 1999-2000 Plains, Georgia |
||||||
| Brand-Variety | Yield1 (bu/acre) |
Test Wt (lb/bu) |
Ht (in) |
Lodg. (%) |
Winter Survival (%) |
Head Date (mo/day) |
| Early Maturing Varieties | ||||||
| UGA 93059LE6 | 79.7 | 58.8 | 40 | 0 | 100 | 03/28 |
| GA92601E9 | 77.0 | 61.6 | 41 | 0 | 100 | 03/30 |
| S St FFR-518-R | 75.9 | 56.6 | 38 | 0 | 100 | 03/31 |
| USG 3209 | 74.5 | 57.8 | 37 | 0 | 100 | 04/02 |
| Fleming | 73.4 | 60.1 | 38 | 0 | 100 | 03/27 |
| GA92412LE16 | 72.6 | 61.8 | 38 | 0 | 100 | 03/30 |
| UGA 91426E39 | 71.6 | 59.8 | 39 | 0 | 100 | 03/31 |
| Pioneer 2691 | 71.2 | 58.0 | 37 | 0 | 100 | 03/29 |
| Terral 422 | 67.2 | 58.0 | 39 | 0 | 100 | 04/03 |
| UGA901146E15 | 63.9 | 56.8 | 36 | 0 | 100 | 03/31 |
| FFR516 | 62.5 | 60.1 | 37 | 0 | 100 | 04/03 |
| NK Coker 9663 | 62.2 | 60.6 | 42 | 0 | 100 | 04/01 |
| AgriPro Mason | 57.9 | 57.2 | 37 | 0 | 100 | 04/01 |
| Average | 70.02 | 59.0 | 38 | 0 | 100 | 03/31 |
| LSD at 10% Level | 5.2 | 1.6 | 1 | – | – | 01 |
| Std. Err. of Entry Mean | 2.2 | 0.7 | 1 | – | – | 01 |
| 1 Yields calculated as 60 pounds per bushel at 13.5% moisture. 2 C.V. = 6.2%, and df for EMS = 36. Bolding indicates entries yielding equal to highest yielding entry within a column based on Fisher’s protected LSD (P = 0.10). |
||||||
| Planted: | December 1, 1999. | |||||
| Harvested: | May 23, 2000. | |||||
| Seeding Rate: | 22 seeds per foot in 7″ rows. | |||||
| Soil Type: | Greenville sandy clay loam. | |||||
| Soil Test: | P = High, K = High, and pH = 6.2. | |||||
| Fertilization: | Preplant: 9 lb N, 54 lb P2O5, and 27 lb K2O/acre. Topdress: 60 lb N/acre. |
|||||
| Management: | Subsoiled and rototilled. | |||||
| Previous Crop: | Peanut. | |||||
| Test conducted by A. E. Coy, M. D. Pippin, and R. R. Pines. | ||||||
| Wheat Grain Performance, 1999-2000 Midville, Georgia |
|||||||||
| Brand-Variety | Yield1 | 2000 Data | |||||||
| 3-Year Avg. | 2-Year Avg. | Rank | Yield(bu/acre) | Test Wt(lb/bu) | Ht(in) | Lodg.(%) | Winter Survival(%) | Head Date(mo/day) | |
| – bu/acre – | |||||||||
| UGA90524E35 | 53.7 | 55.5 | 4 | 56.1 | 52.2 | 36 | 38 | 100 | 04/01 |
| AGS 2000 | 49.1 | 55.1 | 7 | 54.7 | 55.0 | 40 | 11 | 100 | 04/02 |
| Pioneer 26R61 | 48.6 | 54.7 | 5 | 55.2 | 55.7 | 42 | 13 | 100 | 04/04 |
| Pioneer 2684 | 46.4 | 50.6 | 19 | 45.8 | 56.5 | 38 | 40 | 100 | 04/02 |
| Roberts | 41.5 | 49.0 | 13 | 51.9 | 55.6 | 39 | 43 | 100 | 04/05 |
| NK Coker 9835 | 40.0 | 49.0 | 12 | 52.3 | 54.0 | 36 | 18 | 100 | 04/01 |
| Jaypee | 37.1 | 38.2 | 26 | 33.3 | 54.9 | 38 | 86 | 100 | 03/31 |
| Roane | 31.1 | 31.7 | 29 | 30.0 | 54.4 | 36 | 13 | 100 | 04/12 |
| Jackson | 30.6 | 31.1 | 32 | 22.2 | 51.3 | 35 | 56 | 100 | 04/06 |
| GA921204E44 | . | . | 1 | 58.8 | 57.5 | 41 | 21 | 100 | 03/30 |
| GA921221E16 | . | . | 2 | 57.2 | 52.2 | 39 | 21 | 100 | 03/30 |
| Pioneer XW682 | . | . | 3 | 57.2 | 56.1 | 41 | 8 | 100 | 04/03 |
| GA90524E1 | . | . | 6 | 55.1 | 56.4 | 36 | 13 | 100 | 04/02 |
| Pioneer 26R24 | . | . | 8 | 53.7 | 54.2 | 41 | 28 | 100 | 04/05 |
| GA921206E38 | . | . | 9 | 53.5 | 55.2 | 39 | 40 | 100 | 03/31 |
| UGA 91436E29 | . | 52.5 | 10 | 52.8 | 54.2 | 39 | 23 | 100 | 04/07 |
| LA90144B16-3-2 | . | . | 11 | 52.7 | 54.6 | 38 | 5 | 100 | 04/01 |
| AR 494B-2-2 | . | . | 14 | 51.9 | 56.1 | 39 | 21 | 100 | 04/06 |
| GA921188E43 | . | . | 15 | 49.8 | 54.2 | 39 | 25 | 100 | 03/31 |
| GA93132E6 | . | . | 16 | 47.9 | 56.6 | 37 | 89 | 100 | 04/01 |
| VA96W-158 | . | . | 17 | 46.7 | 53.3 | 40 | 54 | 100 | 04/04 |
| LA90518PB43-3-1-4 | . | . | 18 | 46.4 | 53.6 | 39 | 33 | 100 | 04/02 |
| VA96W-270 | . | . | 20 | 44.5 | 54.7 | 38 | 18 | 100 | 04/04 |
| AgriPro BL94-0026 | . | . | 21 | 40.0 | 50.8 | 38 | 53 | 100 | 04/01 |
| UGA 92485-E15 | . | 53.1 | 22 | 39.3 | 56.4 | 40 | 16 | 100 | 04/01 |
| AR 584A-3-1 | . | . | 23 | 39.2 | 53.2 | 41 | 55 | 100 | 04/07 |
| UGA 911316E46 | . | 44.5 | 24 | 36.6 | 54.1 | 36 | 90 | 100 | 04/04 |
| LA8983B14-3-1-2 | . | . | 25 | 34.9 | 54.5 | 35 | 55 | 100 | 04/01 |
| LA9070G45-3-3-1 | . | . | 27 | 33.3 | 50.6 | 35 | 89 | 100 | 04/02 |
| Croplan SR218 | . | . | 28 | 30.9 | 53.2 | 40 | 15 | 100 | 04/11 |
| AgriPro D95-7763 | . | . | 30 | 29.6 | 51.8 | 40 | 68 | 100 | 04/06 |
| AR656-5-1 | . | . | 31 | 22.4 | 51.4 | 38 | 38 | 100 | 04/07 |
| Croplan SR204 | . | . | 33 | 15.3 | 52.0 | 38 | 75 | 100 | 04/08 |
| Average | 42.0 | 47.1 | 44.02 | 54.1 | 38 | 38 | 100 | 04/03 | |
| LSD at 10% Level | 4.8 | 5.8 | 6.6 | 1.8 | 1 | 21 | – | 01 | |
| Std. Err. of Entry Mean | 2.0 | 2.4 | 2.8 | 0.7 | 1 | 9 | – | 01 | |
| 1 Yields calculated as 60 pounds per bushel at 13.5% moisture. 2 C.V. = 12.9%, and df for EMS = 96. Bolding indicates entries yielding equal to highest yielding entry within a column based on Fisher’s protected LSD (P = 0.10). |
|||||||||
| Planted: | November 11, 1999. | ||||||||
| Harvested: | May 31, 2000. | ||||||||
| Seeding Rate: | 22 seeds per foot in 7″ rows. | ||||||||
| Soil Type: | Dothan loamy sand. | ||||||||
| Soil Test: | P = Medium, K = Medium, and pH = 6.1. | ||||||||
| Fertilization: | 33 lb N, 66 lb P2O5, and 99 lb K2O/acre. 72 lb N/acre. |
||||||||
| Management: | Chisel plowed and rototilled twice. | ||||||||
| Previous Crop: | Soybean | ||||||||
| Test conducted by A. E. Coy, M. D. Pippin, and R. D. McNeill IV. | |||||||||
| Late-Planted Wheat Grain Performance, 1999-2000 Midville, Georgia |
| NOTE: A late-planted test was planted and harvested at this location, but due to drought and low yield, the data will not be included in this report. |
| Wheat Grain Performance, 1999-2000 Griffin, Georgia |
||||||||||
| Brand-Variety | Yield1 | 2000 Data | ||||||||
| 3-Year Avg. | 2-Year Avg. | Rank | Yield (bu/ acre) |
Test Wt (lb/ bu) |
Ht (in) |
Lodg.(%) | Winter Survival (%) |
Head Date (mo/ day) |
Straw Wt (lb/ acre) |
|
| – bu/acre – | ||||||||||
| AGS 2000 | 95.4 | 97.1 | 3 | 95.9 | 63.1 | 40 | 0 | 100 | 04/02 | 3679 |
| USG 3209 | 92.6 | 101.6 | 2 | 98.1 | 61.8 | 37 | 0 | 100 | 04/06 | 3115 |
| Pioneer 26R61 | 90.8 | 101.4 | 1 | 101.5 | 63.4 | 41 | 0 | 100 | 04/06 | 4214 |
| Terral 422 | 90.2 | 91.6 | 10 | 91.8 | 60.7 | 38 | 0 | 100 | 04/05 | 3478 |
| UGA901146E15 | 88.8 | 92.6 | 17 | 88.9 | 60.7 | 36 | 0 | 100 | 03/31 | 2359 |
| NK Coker 9663 | 86.8 | 93.5 | 12 | 91.4 | 61.8 | 42 | 0 | 100 | 04/02 | 3243 |
| Pioneer 2684 | 86.6 | 95.0 | 11 | 91.6 | 63.0 | 39 | 0 | 100 | 04/04 | 3330 |
| NK Coker 9835 | 86.3 | 87.6 | 21 | 86.3 | 60.2 | 37 | 0 | 100 | 04/05 | 2435 |
| Roberts | 85.3 | 92.2 | 5 | 92.9 | 60.9 | 39 | 0 | 100 | 04/06 | 2742 |
| NK Coker 9704 | 84.3 | 92.8 | 29 | 83.8 | 63.0 | 38 | 0 | 100 | 04/10 | 2385 |
| Jaypee | 84.1 | 92.2 | 33 | 83.0 | 61.7 | 37 | 0 | 100 | 04/01 | 2178 |
| UGA90524E35 | 83.3 | 88.2 | 20 | 86.7 | 59.0 | 36 | 0 | 100 | 04/02 | 2577 |
| Pioneer 2691 | 80.8 | 90.2 | 22 | 86.3 | 61.2 | 37 | 0 | 100 | 03/30 | 2439 |
| Jackson | 79.9 | 85.6 | 32 | 83.3 | 62.2 | 41 | 0 | 100 | 04/11 | 2455 |
| AgriPro Mason | 79.5 | 84.5 | 45 | 76.3 | 61.0 | 38 | 0 | 100 | 04/02 | 2755 |
| NK Coker 9803 | 79.2 | 86.0 | 42 | 76.9 | 62.8 | 38 | 0 | 100 | 04/09 | 2494 |
| Roane | 79.0 | 84.8 | 39 | 79.3 | 62.9 | 37 | 0 | 100 | 04/17 | 2463 |
| GA921221E16 | . | . | 4 | 95.3 | 60.9 | 41 | 0 | 100 | 03/31 | 3167 |
| Pioneer XW682 | . | . | 6 | 92.8 | 62.5 | 41 | 0 | 100 | 04/03 | 3888 |
| VA96W-158 | . | . | 7 | 92.7 | 60.3 | 40 | 0 | 100 | 04/04 | 2912 |
| GA90524E1 | . | . | 8 | 92.2 | 61.8 | 38 | 0 | 100 | 04/05 | 2788 |
| UGA 92485-E15 | . | 99.1 | 9 | 92.2 | 63.3 | 42 | 0 | 100 | 04/04 | 3742 |
| UGA 91426E39 | . | 92.0 | 13 | 89.8 | 62.4 | 40 | 0 | 100 | 04/01 | 2912 |
| LA9070G45-3-3-1 | . | . | 14 | 89.7 | 60.4 | 37 | 0 | 100 | 04/02 | 2614 |
| S St FFR-518-R | . | 90.9 | 15 | 89.4 | 61.5 | 38 | 0 | 100 | 04/01 | 2753 |
| Pioneer 26R24 | . | . | 16 | 89.2 | 62.4 | 40 | 0 | 100 | 04/05 | 2805 |
| AgriPro BL94-0026 | . | . | 18 | 87.2 | 59.9 | 39 | 0 | 100 | 04/05 | 3108 |
| UGA 911316E46 | . | 86.9 | 19 | 86.9 | 62.3 | 35 | 0 | 100 | 04/05 | 2897 |
| GA921206E38 | . | . | 23 | 85.4 | 61.3 | 38 | 0 | 100 | 04/02 | 2794 |
| AgriPro Hickory | . | 90.0 | 24 | 84.9 | 62.0 | 39 | 0 | 100 | 04/04 | 2768 |
| UGA 91436E29 | . | 86.1 | 25 | 84.7 | 61.3 | 39 | 0 | 100 | 04/10 | 2489 |
| AR 494B-2-2 | . | . | 26 | 84.4 | 61.2 | 40 | 0 | 100 | 04/07 | 3043 |
| FFR522 | . | . | 27 | 84.1 | 62.3 | 41 | 0 | 100 | 04/09 | 2912 |
| LA90518PB43-3-1-4 | . | . | 28 | 84.0 | 60.4 | 40 | 0 | 100 | 04/02 | 3380 |
| FFR516 | . | . | 30 | 83.5 | 60.9 | 38 | 0 | 100 | 04/05 | 3110 |
| VA96W-270 | . | . | 31 | 83.5 | 61.8 | 39 | 0 | 100 | 04/04 | 2505 |
| GA93132E6 | . | . | 34 | 82.1 | 62.6 | 40 | 0 | 100 | 04/03 | 2516 |
| GA921204E44 | . | . | 35 | 82.0 | 62.4 | 41 | 0 | 100 | 03/31 | 3158 |
| LA90144B16-3-2 | . | . | 36 | 81.9 | 61.6 | 37 | 0 | 100 | 04/02 | 3223 |
| GA921188E43 | . | . | 37 | 81.6 | 61.3 | 42 | 0 | 100 | 04/01 | 3232 |
| LA8983B14-3-1-2 | . | . | 38 | 81.2 | 60.3 | 36 | 0 | 100 | 04/02 | 2333 |
| AgriPro D95-7763 | . | . | 40 | 78.7 | 61.3 | 42 | 0 | 100 | 04/07 | 2631 |
| AgriPro Patton | . | 88.5 | 41 | 78.3 | 60.3 | 39 | 0 | 100 | 04/09 | 2844 |
| FFR566 | . | . | 43 | 76.8 | 61.5 | 39 | 0 | 100 | 04/12 | 2831 |
| Croplan SR218 | . | . | 44 | 76.5 | 61.5 | 40 | 0 | 100 | 04/17 | 3110 |
| FFF Exp. 2704 | . | . | 46 | 74.1 | 62.4 | 36 | 0 | 100 | 04/12 | 1701 |
| AR 584A-3-1 | . | . | 47 | 71.9 | 61.2 | 42 | 0 | 100 | 04/08 | 2690 |
| AR656-5-1 | . | . | 48 | 70.7 | 60.5 | 40 | 0 | 100 | 04/12 | 2291 |
| Santee | . | . | 49 | 69.4 | 62.4 | 38 | 0 | 100 | 04/08 | 2642 |
| Croplan SR204 | . | . | 50 | 59.1 | 62.3 | 38 | 0 | 100 | 04/18 | 2034 |
| Average | 85.5 | 91.3 | 84.62 | 61.6 | 39 | 0 | 100 | 04/05 | 2843 | |
| LSD at 10% Level | 4.3 | 4.5 | 6.6 | 0.4 | 2 | – | – | 02 | 554 | |
| Std. Err. of Entry Mean | 1.9 | 1.9 | 2.8 | 0.1 | 1 | – | – | 01 | 237 | |
| 1 Yields calculated as 60 pounds per bushel at 13.5% moisture. 2 C.V. = 6.6%, and df for EMS = 147. Bolding indicates entries yielding equal to highest yielding entry within a column based on Fisher’s protected LSD (P = 0.10). |
||||||||||
| Planted: | November 5, 1999. | |||||||||
| Harvested: | May 30, 2000. | |||||||||
| Seeding Rate: | 22 seeds per foot in 7″ rows. | |||||||||
| Soil Type: | Cecil sandy clay loam. | |||||||||
| Soil Test: | P = Medium, K = High, and pH = 6.5. | |||||||||
| Fertilization: | 28 lb N, 56 lb P2O5, and 84 lb K2O/acre. 60 lb N/acre. |
|||||||||
| Management: | Moldboard plowed and rototilled | |||||||||
| Previous Crop: | Canola. | |||||||||
| Test conducted by P. A. Rose. | ||||||||||
| Wheat Grain Performance, 1999-2000 Calhoun, Georgia |
|||||||||||
| Brand-Variety | Yield1 | 2000 Data | |||||||||
| 3-Year Avg. | 2-Year Avg. | Rank | Yield(bu/ acre) |
Test Wt(lb/ bu) |
Ht(in) | Lodg. (%) |
Winter Survival (%) |
Head Date(mo/ day) |
Straw Wt (lb/ acre) |
BYD2 (%) | |
| -bu/acre- | |||||||||||
| UGA901146E15 | 63.8 | 65.0 | 1 | 73.7 | 58.9 | 38 | 0 | 100 | 04/06 | 2078 | 5 |
| Roane | 62.9 | 54.0 | 23 | 58.3 | 60.9 | 39 | 0 | 100 | 04/10 | 1921 | 0 |
| NK Coker 9704 | 60.3 | 60.4 | 27 | 57.2 | 60.5 | 40 | 0 | 100 | 04/08 | 2361 | 5 |
| NK Coker 9663 | 59.2 | 58.4 | 4 | 67.5 | 59.3 | 43 | 0 | 100 | 04/07 | 2999 | 5 |
| Jackson | 58.2 | 57.4 | 28 | 57.1 | 60.2 | 43 | 0 | 100 | 04/11 | 2729 | 15 |
| Pioneer 2684 | 57.3 | 63.4 | 25 | 57.7 | 60.4 | 41 | 0 | 100 | 04/08 | 2792 | 15 |
| Roberts | 55.8 | 64.0 | 2 | 69.0 | 59.4 | 40 | 0 | 100 | 04/10 | 2690 | 20 |
| AGS 2000 | 55.7 | 57.0 | 5 | 66.0 | 61.3 | 39 | 0 | 100 | 04/12 | 2459 | 2 |
| Jaypee | 55.0 | 58.8 | 9 | 63.8 | 59.3 | 38 | 0 | 100 | 04/12 | 3021 | 12 |
| NK Coker 9803 | 54.1 | 54.2 | 39 | 51.0 | 60.7 | 40 | 0 | 100 | 04/11 | 2770 | 12 |
| USG 3209 | 52.4 | 56.9 | 34 | 56.3 | 59.5 | 39 | 0 | 100 | 04/09 | 2574 | 2 |
| UGA90524E35 | 52.0 | 57.0 | 11 | 62.5 | 57.4 | 35 | 0 | 100 | 04/09 | 2653 | 2 |
| NK Coker 9835 | 51.7 | 49.9 | 43 | 48.8 | 58.5 | 35 | 0 | 100 | 04/09 | 2154 | 40 |
| Pioneer 26R61 | 49.5 | 56.3 | 10 | 63.4 | 61.1 | 44 | 0 | 100 | 04/07 | 2829 | 10 |
| AgriPro Mason | 48.2 | 47.1 | 45 | 46.8 | 59.5 | 41 | 0 | 100 | 04/06 | 2540 | 27 |
| Pioneer 2691 | 45.5 | 47.2 | 48 | 42.9 | 58.7 | 37 | 0 | 100 | 04/09 | 2287 | 2 |
| Terral 422 | 43.8 | 46.7 | 14 | 61.7 | 59.1 | 39 | 0 | 100 | 04/10 | 2239 | 12 |
| VA96W-158 | . | . | 3 | 67.9 | 58.2 | 44 | 0 | 100 | 04/09 | 2470 | 15 |
| GA921188E43 | . | . | 6 | 65.7 | 58.8 | 42 | 0 | 100 | 04/08 | 2648 | 7 |
| AR 494B-2-2 | . | . | 7 | 64.5 | 59.3 | 42 | 0 | 100 | 04/07 | 2829 | 0 |
| Pioneer 26R24 | . | . | 8 | 64.3 | 59.6 | 44 | 0 | 100 | 04/10 | 2801 | 7 |
| LA90518PB43-3-1-4 | . | . | 12 | 62.2 | 58.5 | 41 | 0 | 100 | 04/08 | 2461 | 12 |
| FFF Exp. 2704 | . | . | 13 | 61.8 | 60.3 | 40 | 0 | 100 | 04/09 | 2733 | 5 |
| Pioneer XW682 | . | . | 15 | 61.5 | 60.4 | 45 | 0 | 100 | 04/10 | 3221 | 32 |
| UGA 911316E46 | . | 58.6 | 16 | 61.4 | 60.2 | 35 | 0 | 100 | 04/09 | 2751 | 25 |
| S St FFR-518-R | . | 50.8 | 17 | 60.2 | 58.7 | 37 | 0 | 100 | 04/05 | 2298 | 7 |
| VA96W-270 | . | . | 18 | 59.1 | 59.8 | 42 | 0 | 100 | 04/09 | 2503 | 5 |
| LA9070G45-3-3-1 | . | . | 19 | 59.1 | 58.7 | 38 | 0 | 100 | 04/11 | 1980 | 2 |
| GA93132E6 | . | . | 20 | 58.6 | 60.8 | 43 | 0 | 100 | 04/09 | 3091 | 18 |
| UGA 92485-E15 | . | 51.8 | 21 | 58.4 | 60.3 | 43 | 0 | 100 | 04/09 | 2757 | 2 |
| FFR566 | . | . | 22 | 58.3 | 58.9 | 42 | 0 | 100 | 04/07 | 2812 | 2 |
| AR 584A-3-1 | . | . | 24 | 57.8 | 59.0 | 46 | 0 | 100 | 04/09 | 2409 | 7 |
| AgriPro Hickory | . | 59.2 | 26 | 57.4 | 59.4 | 42 | 0 | 100 | 04/08 | 2834 | 7 |
| FFR522 | . | . | 29 | 57.1 | 59.8 | 49 | 0 | 100 | 04/11 | 2128 | 20 |
| AgriPro Patton | . | 49.2 | 30 | 56.9 | 57.3 | 43 | 0 | 100 | 04/11 | 2714 | 2 |
| LA90144B16-3-2 | . | . | 31 | 56.8 | 58.6 | 38 | 0 | 100 | 04/09 | 3143 | 2 |
| GA921221E16 | . | . | 32 | 56.5 | 58.8 | 41 | 0 | 100 | 04/08 | 2276 | 20 |
| GA90524E1 | . | . | 33 | 56.4 | 59.5 | 36 | 0 | 100 | 04/10 | 2008 | 22 |
| Croplan SR218 | . | . | 35 | 55.8 | 59.6 | 44 | 0 | 100 | 04/10 | 2640 | 7 |
| UGA 91436E29 | . | 57.5 | 36 | 55.4 | 58.1 | 38 | 0 | 100 | 04/07 | 2886 | 2 |
| Croplan SR204 | . | . | 37 | 53.7 | 61.1 | 42 | 0 | 100 | 04/08 | 2592 | 5 |
| LA8983B14-3-1-2 | . | . | 38 | 52.8 | 58.6 | 37 | 0 | 100 | 04/09 | 1973 | 25 |
| GA921204E44 | . | . | 40 | 50.1 | 60.0 | 42 | 0 | 100 | 04/09 | 2581 | 2 |
| UGA 91426E39 | . | 56.9 | 41 | 49.6 | 59.6 | 39 | 0 | 100 | 04/10 | 2481 | 10 |
| AgriPro D95-7763 | . | . | 42 | 49.3 | 59.1 | 44 | 0 | 100 | 04/07 | 2300 | 10 |
| AR656-5-1 | . | . | 44 | 47.5 | 58.3 | 43 | 0 | 100 | 04/11 | 1751 | 15 |
| GA921206E38 | . | . | 46 | 45.4 | 58.4 | 39 | 0 | 100 | 04/07 | 2097 | 5 |
| AgriPro BL94-0026 | . | . | 47 | 43.9 | 56.9 | 38 | 0 | 100 | 04/12 | 2677 | 0 |
| Santee | . | . | 49 | 42.5 | 59.1 | 42 | 0 | 100 | 04/09 | 1819 | – |
| FFR516 | . | . | 50 | 38.5 | 57.8 | 41 | 0 | 100 | 04/09 | 2278 | 1 |
| Average | 54.4 | 55.7 | 57.03 | 59.3 | 41 | 0 | 100 | 04/09 | 2521 | 10 | |
| LSD at 10% Level | 5.8 | N.S.4 | 8.9 | 0.6 | 3 | – | – | N.S. | 577 | – | |
| Std. Err. of Entry Mean | 2.5 | 2.9 | 3.8 | 0.2 | 1 | – | – | 02 | 247 | – | |
| 1 Yields calculated as 60 pounds per bushel at 13.5% moisture. 2 Barley Yellow Dwarf disease. 3 C.V. = 13.3%, and df for EMS = 147. 4 The F-test indicated no statistical difference at the alpha = 0.1 probability level; therefore, an LSD value was not calculated. Bolding indicates entries yielding equal to highest yielding entry within a column based on Fisher’s protected LSD (P = 0.10). |
|||||||||||
| Planted: | October 22, 1999. | ||||||||||
| Harvested: | June 9, 2000. | ||||||||||
| Seeding Rate: | 22 seeds per foot in 7″ rows. | ||||||||||
| Soil Type: | Waynesboro loam. | ||||||||||
| Soil Test: | P = High, K = High, and pH = 6.3. | ||||||||||
| Fertilization: | Preplant: 20 lb N, 40 lb P2O5, and 60 lb K2O/acre. Topdress: 70 lb N/acre. |
||||||||||
| Management: | Moldboard plowed and rototilled. | ||||||||||
| Previous Crop: | Canola. | ||||||||||
| Test conducted by P. A. Rose, G. Rawls, and J. Stubbs. | |||||||||||
| Summary of Wheat Yields Georgia, 1998-2000 with Two- and Three Year Averages |
|||||||||
| Brand-Variety | Yield1 | ||||||||
| South2 | North3 | Statewide | |||||||
| 2000 | 2-Year Avg. | 3-Year Avg. | 2000 | 2-Year Avg. | 3-Year Avg. | 2000 | 2-Year Avg. | 3-Year Avg. | |
| ———————————- bu/acre ———————————- | |||||||||
| AGS 2000 | 71.0 | 65.2 | 63.0 | 81.0 | 77.1 | 75.5 | 75.0 | 69.9 | 68.0 |
| AR 494B-2-2 | 63.6 | . | . | 74.5 | . | . | 67.9 | . | . |
| AR 584A-3-1 | 52.8 | . | . | 64.9 | . | . | 57.6 | . | . |
| AR656-5-1 | 49.8 | . | . | 59.1 | . | . | 53.5 | . | . |
| AgriPro D95-7763 | 54.5 | . | . | 64.0 | . | . | 58.3 | . | . |
| AgriPro Hickory | . | . | . | 71.2 | 74.6 | . | . | . | . |
| AgriPro Mason | . | . | . | 61.5 | 65.8 | 63.8 | . | . | . |
| AgriPro Patton | . | . | . | 67.6 | 68.9 | . | . | . | . |
| Croplan SR204 | 40.0 | . | . | 56.4 | . | . | 46.5 | . | . |
| Croplan SR218 | 49.4 | . | . | 66.1 | . | . | 56.1 | . | . |
| FFF Exp. 2704 | . | . | . | 68.0 | . | . | . | . | . |
| FFR516 | . | . | . | 61.0 | . | . | . | . | . |
| FFR522 | . | . | . | 70.6 | . | . | . | . | . |
| FFR566 | . | . | . | 67.5 | . | . | . | . | . |
| GA90524E1 | 69.8 | . | . | 74.3 | . | . | 71.6 | . | . |
| GA921188E43 | 65.3 | . | . | 73.7 | . | . | 68.7 | . | . |
| GA921204E44 | 65.6 | . | . | 66.1 | . | . | 65.8 | . | . |
| GA921206E38 | 63.4 | . | . | 65.4 | . | . | 64.2 | . | . |
| GA921221E16 | 66.4 | . | . | 75.9 | . | . | 70.2 | . | . |
| GA93132E6 | 65.1 | . | . | 70.3 | . | . | 67.2 | . | . |
| Jackson | 50.1 | 40.0 | 41.4 | 70.2 | 71.5 | 69.1 | 58.1 | 52.6 | 52.5 |
| Jaypee | 57.3 | 51.4 | 51.3 | 73.4 | 75.5 | 69.6 | 63.7 | 61.1 | 58.6 |
| LA8983B14-3-1-2 | 59.5 | . | . | 67.0 | . | . | 62.5 | . | . |
| LA90144B16-3-2 | 65.3 | . | . | 69.4 | . | . | 67.0 | . | . |
| LA90518PB43-3-1-4 | 62.6 | . | . | 73.1 | . | . | 66.8 | . | . |
| LA9070G45-3-3-1 | 61.9 | . | . | 74.4 | . | . | 66.9 | . | . |
| NK BL94-0026 | 58.9 | . | . | 65.6 | . | . | 61.6 | . | . |
| NK Coker 9663 | . | . | . | 79.4 | 75.9 | 73.0 | . | . | . |
| NK Coker 9704 | . | . | . | 70.5 | 76.6 | 72.3 | . | . | . |
| NK Coker 9803 | . | . | . | 64.0 | 70.1 | 66.7 | . | . | . |
| NK Coker 9835 | 66.0 | 59.0 | 54.9 | 67.5 | 68.7 | 69.0 | 66.6 | 62.9 | 60.5 |
| Pioneer 2684 | 64.6 | 61.7 | 58.7 | 74.6 | 79.2 | 72.0 | 68.6 | 68.7 | 64.0 |
| Pioneer 2691 | . | . | . | 64.6 | 68.7 | 63.1 | . | . | . |
| Pioneer 26R24 | 71.3 | . | . | 76.8 | . | . | 73.5 | . | . |
| Pioneer 26R61 | 70.6 | 64.3 | 60.2 | 82.5 | 78.8 | 70.1 | 75.3 | 70.1 | 64.2 |
| Pioneer XW682 | 75.1 | . | . | 77.2 | . | . | 75.9 | . | . |
| Roane | 48.3 | 38.4 | 38.7 | 68.8 | 69.4 | 70.9 | 56.5 | 50.8 | 51.6 |
| Roberts | 67.5 | 55.7 | 51.7 | 81.0 | 78.1 | 70.5 | 72.9 | 64.7 | 59.2 |
| S St FFR-518-R | . | . | . | 74.8 | 70.8 | . | . | . | . |
| Santee | . | . | . | 55.9 | . | . | . | . | . |
| Terral 422 | . | . | . | 76.7 | 69.1 | 67.0 | . | . | . |
| UGA 911316E46 | 58.0 | 54.3 | . | 74.1 | 72.8 | . | 64.5 | 61.7 | . |
| UGA 91426E39 | . | . | . | 69.7 | 74.4 | . | . | . | . |
| UGA 91436E29 | 60.1 | 54.1 | . | 70.1 | 71.8 | . | 64.1 | 61.2 | . |
| UGA 92485-E15 | 59.9 | 60.6 | . | 75.3 | 75.5 | . | 66.1 | 66.5 | . |
| UGA901146E15 | . | . | . | 81.3 | 78.8 | 76.3 | . | . | . |
| UGA90524E35 | 70.0 | 63.7 | 62.6 | 74.6 | 72.6 | 67.6 | 71.8 | 67.3 | 64.6 |
| USG 3209 | . | . | . | 77.2 | 79.2 | 72.5 | . | . | . |
| VA96W-158 | 67.1 | . | . | 80.3 | . | . | 72.4 | . | . |
| VA96W-270 | 64.0 | . | . | 71.3 | . | . | 66.9 | . | . |
| Average | 61.7 | 55.7 | 53.6 | 70.8 | 73.5 | 69.9 | 65.6 | 63.1 | 60.4 |
| LSD at 10% Level | 3.7 | 2.8 | 2.1 | 8.2 | 7.3 | 5.7 | 3.9 | 3.4 | 2.7 |
| Std. Err. of Entry Mean | 1.6 | 2.1 | 1.4 | 2.8 | 4.5 | 3.5 | 2.2 | 3.2 | 2.5 |
| 1 Yields calculated at 60 pounds per bushel at 13.5% moisture. 2 Tifton, Plains, and Midville. 3 Griffin and Calhoun. Bolding indicates entries yielding equal to highest yielding entry within a column based on Fisher’s protected LSD (P = 0.10). |
|||||||||
| Summary of Late-Planted Wheat Yields: Georgia, 1999-2000 | |
| Brand-Variety | Yield1 South2 2000 — bu/acre — |
| AgriPro Mason | 58.2 |
| FFR516 | 60.0 |
| Fleming | 69.6 |
| GA92412LE16 | 69.3 |
| GA92601E9 | 70.1 |
| NK Coker 9663 | 63.3 |
| Pioneer 2691 | 68.9 |
| S St FFR-518-R | 74.5 |
| Terral 422 | 66.0 |
| UGA 91426E39 | 68.9 |
| UGA 93059LE6 | 75.3 |
| UGA901146E15 | 67.5 |
| USG 3209 | 72.6 |
| Average | 68.0 |
| LSD at 10% Level | 4.0 |
| Std. Err. of Entry Mean | 2.4 |
| 1 Yields calculated as 60 pounds per bushel at 13.5% moisture. 2 Plains and Tifton. |
|
| NOTE: A test of these varieties was planted and harvested at Midville, but due to drought and low yields the data were not included in this summary. | |
Southern Uniform Tests
| Uniform Southern Soft Red Winter Wheat Nursery, 1999-2000 Plains, Georgia |
||||||||
| Brand-Variety | Yield1 (bu/acre) | Test Wt(lb/bu) | Heading Date(Julian days5) | Ht(in) | Lodg.(rating) | Powdery Mildew2 (rating) | Leaf Rust3 (rating) | Hessian Fly4 (rating) |
| GA93059LE6 | 127.5 | 60.9 | 82 | 38 | 2 | 0 | 1 | MR |
| AGS2000 | 125.7 | 60.3 | 85 | 38 | 3 | 0 | 2 | R |
| LA90185G3-1-3-4-2 | 125.0 | 59.8 | 85 | 39 | 8 | 0 | 9 | R |
| VA96W-270 | 125.0 | 60.6 | 91 | 38 | 0 | 0 | 4 | R |
| Coker 9835 | 124.5 | 58.1 | 85 | 34 | 2 | 1 | 9 | R |
| VA98W-593 | 123.8 | 62.7 | 92 | 32 | 0 | 0 | 1 | R |
| GA91426E39 | 120.5 | 61.5 | 85 | 39 | 1 | 2 | 1 | R |
| GA90552AE33 | 120.2 | 62.9 | 85 | 38 | 0 | 0 | 2 | S |
| LA90518PB43-3-1-4 | 117.2 | 59.7 | 85 | 40 | 0 | 3 | 0 | R |
| VA97W-206 | 116.2 | 59.0 | 102 | 33 | 0 | 1 | 5 | S |
| TX91-57 | 115.6 | 60.5 | 100 | 44 | 0 | 0 | 2 | R |
| NC96-13155 | 112.8 | 60.6 | 102 | 35 | 0 | 0 | 0 | R |
| LA90115C25-3-6-2 | 112.4 | 60.2 | 85 | 34 | 3 | 4 | 6 | S |
| B950590 | 112.3 | 58.7 | 100 | 35 | 0 | 0 | 0 | S |
| AW-M96*4403 | 112.1 | 59.0 | 102 | 38 | 0 | 1 | 3 | R |
| LA8983B14-3-1-4 | 111.9 | 60.1 | 84 | 33 | 1 | 2 | 4 | S |
| B950943 | 109.8 | 58.8 | 101 | 35 | 0 | 4 | 1 | S |
| AW-M94*1626-7 | 109.0 | 61.7 | 102 | 40 | 0 | 0 | 0 | R |
| TX97D6737 | 108.6 | 60.4 | 85 | 35 | 2 | 5 | 4 | S |
| Coker 9663 | 108.1 | 60.6 | 84 | 40 | 6 | 6 | 4 | S |
| S9412192 | 107.7 | 59.5 | 82 | 38 | 0 | 4 | 3 | S |
| AR647-1-6 | 102.5 | 61.3 | 100 | 42 | 0 | 5 | 0 | S |
| NC96-13965 | 102.2 | 60.8 | 102 | 36 | 0 | 0 | 0 | R |
| SC921299 | 101.3 | 61.9 | 93 | 33 | 2 | 0 | 1 | S |
| Mason | 100.3 | 59.2 | 83 | 41 | 4 | 8 | 5 | S |
| TX91-27 | 96.3 | 58.5 | 102 | 39 | 0 | 2 | 1 | R |
| AR656-5-1 | 96.3 | 58.1 | 98 | 41 | 0 | 0 | 7 | S |
| SC921285 | 93.7 | 61.9 | 92 | 36 | 1 | 3 | 1 | S |
| TX96D1320 | 92.5 | 59.0 | 101 | 32 | 0 | 5 | 0 | R |
| TX97D4556 | 90.5 | 61.2 | 89 | 32 | 0 | 3 | 0 | S |
| TX97D6719 | 90.3 | 60.7 | 102 | 36 | 0 | 2 | 1 | S |
| B950904 | 78.0 | 57.8 | 104 | 32 | 0 | 3 | 3 | VS |
| AW-D97-6750 | 76.0 | 58.9 | 100 | 34 | 0 | 1 | 4 | S |
| Average | 108.16 | 60.1 | 93 | 37 | ||||
| LSD at 5% Level | 10.4 | |||||||
| 1 Yields calculated as 60 pounds per bushel. 2 Powdery mildew rating: 0 = resistant to 9 = highly susceptible. 3 Rating on flag leaf: 0 = resistant to 9 = highly susceptible. 4 Hessian fly rating: R = resistant, MR = moderately resistant, MS = moderately susceptible, S = susceptible. 5 Days from January 1. 6 C.V. = 7.4%. Bolding indicates entries yielding equal to highest yielding entry within a column based on Fisher’s protected LSD (P = 0.10). |
||||||||
| Planted: | November 11, 1999. | |||||||
| Harvested: | May 22, 2000. | |||||||
| Seeding Rate: | 22 seeds per foot in 7″ rows. | |||||||
| Soil Type: | Greenville sandy clay loam. | |||||||
| Soil Test: | P = High, K = High, and pH = 6.2. | |||||||
| Fertilization: | 90 lb N, 0 lb P2O5, and 0 lb K2O/acre. | |||||||
| Management: | Subsoiled and rototilled. | |||||||
| Previous Crop: | Peanut. | |||||||
| Test conducted by J. W. Johnson, B. M. Cunfer, and D. Bland. | ||||||||
| Uniform Southern Soft Red Winter Wheat Nursery, 1999-2000 Griffin, Georgia |
|||||||
| Brand-Variety | Yield1 (bu/acre) |
Test Wt(lb/bu) | Heading Date (Julian days4) |
Ht (in) |
Lodg.(rating) | Powdery Mildew2 (rating) | Leaf Rust3 (rating) |
| AGS2000 | 110.5 | 60.6 | 94 | 37 | 0 | 1 | 0 |
| GA90552AE33 | 106.3 | 61.6 | 96 | 38 | 0 | 0 | 1 |
| LA90185G3-1-3-4-2 | 105.6 | 59.2 | 94 | 40 | 0 | 0 | 1 |
| NC96-13155 | 101.6 | 61.1 | 103 | 38 | 0 | 0 | 0 |
| GA93059LE6 | 100.6 | 60.9 | 89 | 37 | 0 | 0 | 0 |
| GA91426E39 | 99.4 | 60.9 | 95 | 35 | 0 | 0 | 0 |
| LA90518PB43-3-1-4 | 99.1 | 59.1 | 93 | 39 | 0 | 2 | 1 |
| NC96-13965 | 98.6 | 61.1 | 102 | 36 | 0 | 0 | 0 |
| VA96W-270 | 98.5 | 59.9 | 96 | 36 | 0 | 0 | 0 |
| TX91-57 | 98.2 | 60.0 | 101 | 41 | 0 | 0 | 1 |
| VA97W-206 | 97.0 | 58.8 | 98 | 35 | 0 | 0 | 0 |
| B950590 | 96.1 | 57.9 | 100 | 36 | 0 | 0 | 0 |
| Coker 9663 | 94.5 | 59.5 | 94 | 39 | 0 | 3 | 1 |
| TX91-27 | 93.0 | 58.4 | 101 | 40 | 3 | 2 | 0 |
| VA98W-593 | 90.6 | 62.5 | 97 | 35 | 0 | 0 | 0 |
| SC921299 | 89.4 | 61.7 | 97 | 35 | 0 | 0 | 1 |
| LA8983B14-3-1-4 | 89.3 | 58.7 | 94 | 32 | 0 | 2 | 1 |
| TX97D6737 | 89.1 | 58.9 | 94 | 33 | 0 | 5 | 0 |
| Coker 9835 | 86.1 | 58.1 | 98 | 30 | 0 | 2 | 5 |
| B950904 | 85.2 | 59.8 | 100 | 37 | 0 | 0 | 0 |
| B950943 | 85.0 | 59.2 | 96 | 36 | 0 | 0 | 0 |
| Mason | 84.8 | 59.3 | 93 | 36 | 0 | 6 | 0 |
| SC921285 | 83.5 | 60.8 | 97 | 36 | 0 | 0 | 0 |
| LA90115C25-3-6-2 | 82.9 | 59.8 | 96 | 35 | 0 | 2 | 4 |
| AW-D97-6750 | 81.8 | 61.1 | 101 | 37 | 0 | 0 | 0 |
| AR656-5-1 | 81.4 | 59.2 | 102 | 38 | 0 | 4 | 0 |
| AR647-1-6 | 80.7 | 60.8 | 100 | 38 | 0 | 9 | 0 |
| TX97D6719 | 80.6 | 60.1 | 102 | 36 | 1 | 0 | 0 |
| S9412192 | 79.7 | 58.7 | 91 | 38 | 2 | 2 | 0 |
| AW-M96*4403 | 78.9 | 58.8 | 97 | 38 | 0 | 0 | 0 |
| TX97D4556 | 77.2 | 59.9 | 97 | 32 | 0 | 3 | 0 |
| AW-M94*1626-7 | 75.5 | 61.0 | 103 | 42 | 0 | 0 | 0 |
| TX96D1320 | 66.3 | 58.1 | 97 | 32 | 0 | 6 | 0 |
| Average | 89.95 | 59.9 | 97 | 36 | |||
| LSD at 5% Level | 11.3 | ||||||
| 1 Yields calculated as 60 pounds per bushel. 2 Powdery mildew rating: 0 = resistant to 9 = highly susceptible. 3 Rating on flag leaf: 0 = resistant to 9 = highly susceptible. 4 Days from January 1. 5 C.V. = 8.0%. Bolding indicates entries yielding equal to highest yielding entry within a column based on Fisher’s protected LSD (P = 0.10). |
|||||||
| Planted: | November 4, 1999. | ||||||
| Harvested: | May 31, 2000. | ||||||
| Seeding Rate: | 22 seeds per foot in 7″ rows. | ||||||
| Soil Type: | Cecil clay loam. | ||||||
| Soil Test: | P = Medium, K = High, and pH = 6.9. | ||||||
| Fertilization: | 90 lb N, 0 lb P2O5, and 0 lb K2O/acre. | ||||||
| Management: | Moldboard plowed and rototilled. | ||||||
| Previous Crop: | Peanut. | ||||||
| Test conducted by J. W. Johnson, B. M. Cunfer, and D. Bland. | |||||||
Triticale
| Triticale Grain Performance, 1999-2000 Tifton, Georgia |
||||||||
| Brand-Variety | Yield1 2-Year Avg. |
2000 Data | ||||||
| Rank | Yield (bu/acre) |
Test Wt (lb/bu) |
Ht (in) |
Lodg. (%) |
Winter Survival (%) |
Head Date (mo/day) |
||
| FLPFT215 | 81.2 | 1 | 83.2 | 55.1 | 42 | 0 | 100 | 03/21 |
| TRICAL 498 | 79.2 | 2 | 82.6 | 49.5 | 43 | 0 | 100 | 03/21 |
| FL Florico | 74.0 | 8 | 63.7 | 53.9 | 48 | 0 | 100 | 03/15 |
| Florida 201 | 73.0 | 5 | 69.7 | 50.9 | 46 | 0 | 100 | 03/13 |
| Sunland | 72.8 | 7 | 66.2 | 54.4 | 45 | 0 | 100 | 03/18 |
| Fleming * | 55.8 | 10 | 51.8 | 53.6 | 35 | 0 | 100 | 03/24 |
| FL26ITYN153 | . | 3 | 72.8 | 53.2 | 41 | 0 | 100 | 03/10 |
| FL26ITYN11 | . | 4 | 72.2 | 54.4 | 40 | 0 | 100 | 03/15 |
| Arcia | . | 6 | 69.4 | 51.4 | 45 | 0 | 100 | 03/29 |
| FL26ITYN12 | . | 9 | 63.0 | 55.2 | 41 | 0 | 100 | 03/13 |
| Average | 72.7 | 69.52 | 53.1 | 42 | 0 | 100 | 03/18 | |
| LSD at 10% Level | N. S.3 | 9.2 | 3.1 | 2 | – | – | 02 | |
| Std. Err. of Entry Mean | 2.2 | 3.8 | 1.3 | 1 | – | – | 01 | |
| * Wheat check. 1 Yields calculated as 48 pounds per bushel at 13.0% moisture. 2 C.V. = 11.0%, and df for EMS = 27. 3 The F-test indicated no statistical difference at the alpha = 0.1 probability level; therefore, an LSD value was not calculated. Bolding indicates entries yielding equal to highest yielding entry within a column based on Fisher’s protected LSD (P = 0.10). |
||||||||
| Planted: | November 30, 1999. | |||||||
| Harvested: | May 30, 2000. | |||||||
| Seeding Rate: | 16 seeds per foot in 7″ rows. (* Wheat: 22 seeds per foot in 7″ rows) | |||||||
| Soil Type: | Tifton loamy sand. | |||||||
| Soil Test: | P = High, K = Medium, and pH = 5.7. | |||||||
| Fertilization: | 40 lb N, 40 lb P2O5, and 40 lb K2O/acre. 40 lb N/acre. |
|||||||
| Management: | Moldboard plowed and rototilled. | |||||||
| Previous Crop: | Cotton. | |||||||
| Test conducted by A. E. Coy and M. D. Pippin. | ||||||||
| Triticale Grain Performance, 1999-2000 Plains, Georgia |
||||||||
| Brand-Variety | Yield1 2-Year Avg. |
2000 Data | ||||||
| Rank | Yield (bu/acre) |
Test Wt (lb/bu) |
Ht (in) |
Lodg. (%) |
Winter Survival (%) |
Head Date (mo/day) |
||
| Sunland | 84.9 | 6 | 92.9 | 55.7 | 46 | 0 | 100 | 03/27 |
| FL Florico | 84.6 | 5 | 101.4 | 55.1 | 49 | 0 | 100 | 03/27 |
| FLPFT215 | 83.4 | 7 | 90.3 | 56.7 | 44 | 0 | 100 | 03/27 |
| Florida 201 | 81.5 | 2 | 102.6 | 53.5 | 45 | 0 | 100 | 03/26 |
| TRICAL 498 | 75.6 | 8 | 87.2 | 48.4 | 44 | 0 | 100 | 03/28 |
| Fleming * | 65.0 | 9 | 74.1 | 60.8 | 38 | 0 | 100 | 03/28 |
| FL26ITYN153 | . | 1 | 102.9 | 54.9 | 43 | 0 | 100 | 03/28 |
| FL26ITYN12 | . | 3 | 101.7 | 56.6 | 41 | 0 | 100 | 03/26 |
| FL26ITYN11 | . | 4 | 101.6 | 55.5 | 43 | 0 | 100 | 03/25 |
| Arcia | . | 10 | 69.2 | 51.2 | 44 | 0 | 100 | 04/01 |
| Average | 79.1 | 92.42 | 54.8 | 43 | 0 | 100 | 03/27 | |
| LSD at 10% Level | N.S.3 | 4.2 | 2.2 | 1 | – | – | 02 | |
| Std. Err. of Entry Mean | 2.0 | 1.8 | 0.9 | 1 | – | – | 01 | |
| * Wheat check. 1 Yields calculated as 48 pounds per bushel at 13.0% moisture. 2 C.V. = 3.8%, and df for EMS = 27. 3 The F-test indicated no statistical difference at the alpha = 0.1 probability level; therefore, an LSD value was not calculated. Bolding indicates entries yielding equal to highest yielding entry within a column based on Fisher’s protected LSD (P = 0.10). |
||||||||
| Planted: | December 1, 1999. | |||||||
| Harvested: | May 23, 2000. | |||||||
| Seeding Rate: | 16 seeds per foot in 7″ rows. (* Wheat: 22 seeds per foot in 7″ rows) | |||||||
| Soil Type: | Greenville sandy clay loam. | |||||||
| Soil Test: | P = High, K = High, and pH = 6.2. | |||||||
| Fertilization: | 9 lb N, 54 lb P2O5, and 27 lb K2O/acre. 60 lb N/acre. |
|||||||
| Management: | Subsoiled and rototilled. | |||||||
| Previous Crop: | Peanut. | |||||||
| Test conducted by A. E. Coy, M. D. Pippin, and R. R. Pines. | ||||||||
| Triticale Grain Performance, 1999-2000 Midville, Georgia |
| NOTE: A triticale test was planted and harvested at this location, but due to drought and low yield, the data will not be included in this report. |
| Summary of Triticale Yields Georgia, 1998-2000 Averages |
||
| Brand-Variety | Yield1 | |
| South2 | ||
| 2000 | 2-Year Average | |
| ——- bu/acre ——- | ||
| Arcia | 69.3 | . |
| FL Florico | 82.6 | 79.3 |
| FL26ITYN11 | 86.9 | . |
| FL26ITYN12 | 82.3 | . |
| FL26ITYN153 | 87.9 | . |
| FLPFT215 | 86.8 | 82.3 |
| Fleming * | 63.0 | 60.4 |
| Florida 201 | 86.2 | 77.3 |
| Seed Resource TRICAL 498 | 84.9 | 77.4 |
| Sunland | 79.5 | 78.8 |
| Average | 80.9 | 75.9 |
| LSD at 10% Level | 5.0 | 3.5 |
| Std. Err. of Entry Mean | 3.0 | 2.1 |
| * Wheat check. 1 Yields calculated at 48 pounds per bushel at 13.0% moisture. 2 Tifton and Plains. Bolding indicates entries yielding equal to highest yielding entry within a column based on Fisher’s protected LSD (P = 0.10). |
||
| NOTE: A test of these varieties was planted and harvested at Midville, but due to drought and low yields the data were not included in this summary. | ||
Oat
| Oat Grain Performance, 1999-2000 Tifton, Georgia |
||||||||||||
| Brand-Variety | Yield1 | 2000 Data | ||||||||||
| 3-Year Avg. | 2-Year Avg. | Rank | Yield (bu/ acre) |
Test Wt (lb/ bu) |
Ht (in) |
Lodg. (%) |
Winter Survival (%) |
Head Date (mo/ day) |
Bird Damage (%) |
Crown Rust 4/26 (%) |
BYD2 (%) |
|
| – bu/acre – | ||||||||||||
| Secretariat | 83.0 | 95.9 | 3 | 121.7 | 36.3 | 52 | 0 | 100 | 03/29 | 2 | 7 | 2 |
| Chapman | 82.1 | 89.1 | 6 | 109.5 | 35.0 | 46 | 0 | 100 | 03/22 | 6 | 12 | 2 |
| Horizon 314 | 81.4 | 91.9 | 4 | 113.2 | 35.2 | 55 | 0 | 100 | 04/02 | 8 | 0 | 1 |
| Rodgers | 78.1 | 92.2 | 2 | 122.1 | 34.2 | 56 | 0 | 100 | 03/29 | 1 | 18 | 0 |
| LA90113AFL2-1-19-3 | . | 105.7 | 1 | 125.5 | 34.4 | 52 | 0 | 100 | 03/30 | 4 | 0 | 5 |
| LA90104C22-7-4-1 | . | 92.0 | 5 | 112.8 | 34.8 | 53 | 0 | 100 | 03/30 | 3 | 10 | 0 |
| LA9339E26 | . | . | 7 | 107.6 | 34.4 | 48 | 0 | 100 | 04/08 | 10 | 0 | 0 |
| Harrison | . | . | 8 | 100.2 | 36.6 | 57 | 0 | 100 | 03/28 | 2 | 5 | 2 |
| SC910337 | . | . | 9 | 84.4 | 37.9 | 53 | 0 | 100 | 03/31 | 2 | 0 | 0 |
| Average | 81.2 | 94.5 | 110.83 | 35.4 | 52 | 0 | 100 | 03/30 | 4 | 6 | 1 | |
| LSD at 10% Level | N.S.4 | N.S. | 7.9 | N.S. | 2 | – | – | 01 | 2 | – | – | |
| Std. Err. of Entry Mean | 2.1 | 2.6 | 3.2 | 1.2 | 1 | – | – | 01 | 1 | – | – | |
| 1 Yields calculated as 32 pounds per bushel at 12.5% moisture. 2 Barley Yellow Dwaft disease. 3 C.V. = 5.9%, and df for EMS = 24. 4 The F-test indicated no statistical difference at the alpha = 0.1 probability level; therefore, an LSD value was not calculated. Bolding indicates entries yielding equal to highest yielding entry within a column based on Fisher’s protected LSD (P = 0.10). |
||||||||||||
| Planted: | November 16, 1999. | |||||||||||
| Harvested: | May 30, 2000. | |||||||||||
| Seeding Rate: | 11 seeds per foot in 7″ rows. | |||||||||||
| Soil Type: | Tifton loamy sand. | |||||||||||
| Soil Test: | P = High, K = Medium, and pH = 5.7. | |||||||||||
| Fertilization: | Preplant: 40 lb N, 40 lb P2O5, and 40 lb K2O/acre. Topdress: 40 lb N/acre. |
|||||||||||
| Management: | Moldboard plowed and rototilled. | |||||||||||
| Previous Crop: | Cotton. | |||||||||||
| Test conducted by A. E. Coy and M. D. Pippin. | ||||||||||||
| Oat Grain Performance, 1999-2000 Plains, Georgia |
|||||||||
| Brand-Variety | Yield1 | 2000 Data | |||||||
| 3-Year Avg. | 2-Year Avg. | Rank | Yield (bu/acre) |
Test Wt (lb/bu) |
Ht (in) |
Lodg. (%) |
Winter Survival (%) |
Head Date (mo/day) |
|
| – bu/acre – | |||||||||
| Horizon 314 | 120.5 | 112.7 | 3 | 142.0 | 32.9 | 52 | 0 | 100 | 04/02 |
| Secretariat | 114.9 | 110.9 | 2 | 142.9 | 33.4 | 49 | 0 | 100 | 03/31 |
| Chapman | 104.8 | 102.8 | 7 | 128.1 | 32.5 | 45 | 0 | 100 | 03/24 |
| Rodgers | 103.0 | 109.4 | 6 | 135.2 | 33.6 | 53 | 0 | 100 | 03/31 |
| LA90113AFL2-1-19-3 | . | 128.7 | 1 | 153.0 | 33.5 | 51 | 0 | 100 | 04/01 |
| Harrison | . | . | 4 | 138.8 | 36.4 | 53 | 0 | 100 | 03/31 |
| LA90104C22-7-4-1 | . | 101.8 | 5 | 137.1 | 33.5 | 49 | 0 | 100 | 04/01 |
| SC910337 | . | . | 8 | 124.6 | 39.5 | 51 | 0 | 100 | 04/01 |
| LA9339E26 | . | . | 9 | 107.9 | 32.0 | 45 | 0 | 100 | 04/03 |
| Average | 110.8 | 111.0 | 134.42 | 34.1 | 50 | 0 | 100 | 03/31 | |
| LSD at 10% Level | N.S.3 | 5.5 | 5.7 | 1.8 | 2 | – | – | 01 | |
| Std. Err. of Entry Mean | 2.9 | 2.3 | 2.3 | 0.7 | 1 | – | – | 01 | |
| 1 Yields calculated as 32 pounds per bushel at 12.5% moisture. 2 C.V. = 3.5%, and df for EMS = 24. 3 The F-test indicated no statistical difference at the alpha = 0.1 probability level; therefore, an LSD value was not calculated. Bolding indicates entries yielding equal to highest yielding entry within a column based on Fisher’s protected LSD (P = 0.10). |
|||||||||
| Planted: | November 15, 1999. | ||||||||
| Harvested: | May 23, 2000. | ||||||||
| Seeding Rate: | 11 seeds per foot in 7″ rows. | ||||||||
| Soil Type: | Greenville sandy clay loam. | ||||||||
| Soil Test: | P = High, K = High, and pH = 6.2. | ||||||||
| Fertilization: | 9 lb N, 54 lb P2O5, and 27 lb K2O/acre. 60 lb N/acre. |
||||||||
| Management: | Subsoiled and rototilled. | ||||||||
| Previous Crop: | Peanut. | ||||||||
| Test conducted by A. E. Coy, M. D. Pippin, and R. R. Pines. | |||||||||
| Oat Grain Performance, 1999-2000 Midville, Georgia |
|||||||||
| Brand-Variety | Yield1 | 2000 Data | |||||||
| 3-Year Avg. | 2-Year Avg. | Rank | Yield (bu/acre) |
Test Wt (lb/bu) |
Ht (in) |
Lodg. (%) |
Winter Survival (%) |
Head Date (mo/day) |
|
| – bu/acre – | |||||||||
| Rodgers | 69.7 | 83.5 | 2 | 82.5 | 33.4 | 44 | 60 | 100 | 04/04 |
| Chapman | 68.7 | 79.4 | 1 | 85.2 | 31.5 | 37 | 28 | 100 | 03/31 |
| Secretariat | 67.8 | 74.1 | 6 | 71.1 | 32.9 | 47 | 35 | 100 | 04/07 |
| Horizon 314 | 67.6 | 74.6 | 5 | 75.3 | 34.8 | 46 | 50 | 100 | 04/09 |
| Harrison | . | . | 3 | 78.9 | 36.5 | 48 | 58 | 100 | 04/03 |
| LA90113AFL2-1-19-3 | . | 84.8 | 4 | 78.0 | 33.3 | 47 | 60 | 100 | 04/07 |
| LA90104C22-7-4-1 | . | 63.1 | 7 | 68.1 | 34.6 | 41 | 60 | 100 | 04/06 |
| LA9339E26 | . | . | 8 | 65.7 | 31.8 | 39 | 53 | 100 | 04/10 |
| SC910337 | . | . | 9 | 62.3 | 38.2 | 44 | 50 | 100 | 04/05 |
| Average | 68.5 | 76.6 | 74.12 | 34.1 | 43 | 50 | 100 | 04/06 | |
| LSD at 10% Level | N.S.3 | N.S. | 8.5 | 1.6 | 4 | N.S. | – | 02 | |
| Std. Err. of Entry Mean | 2.6 | 3.3 | 3.5 | 0.6 | 2 | 11 | – | 01 | |
| 1 Yields calculated as 32 pounds per bushel at 12.5% moisture. 2 C.V. = 9.4%, and df for EMS = 24. 3 The F-test indicated no statistical difference at the alpha = 0.1 probability level; therefore, an LSD value was not calculated. Bolding indicates entries yielding equal to highest yielding entry within a column based on Fisher’s protected LSD (P = 0.10). |
|||||||||
| Planted: | November 10, 1999. | ||||||||
| Harvested: | May 31, 2000. | ||||||||
| Seeding Rate: | 11 seeds per foot in 7″ rows. | ||||||||
| Soil Type: | Dothan loamy sand. | ||||||||
| Soil Test: | P = Medium, K = Medium, and pH = 6.1. | ||||||||
| Fertilization: | 33 lb N, 66 lb P2O5, and 99 lb K2O/acre. 72 lb N/acre. |
||||||||
| Management: | Chisel plowed and rototilled. | ||||||||
| Previous Crop: | Soybean. | ||||||||
| Test conducted by A. E. Coy, M. D. Pippin, and R. D. McNeill IV. | |||||||||
| Oat Grain Performance, 1999-2000 Griffin, Georgia |
|||||||||||
| Brand-Variety | Yield1 | 2000 Data | |||||||||
| 3-Year Avg. | 2-Year Avg. | Rank | Yield (bu/ acre) |
Test Wt (lb/ bu) |
Ht (in) |
Lodg. (%) |
Winter Survival (%) |
Head Date (mo/ day) |
Bird Damage (%) |
Straw Weight (lb/ acre) |
|
| – bu/acre – | |||||||||||
| Horizon 314 | 100.7 | 102.7 | 1 | 149.1 | 36.9 | 46 | 0 | 100 | 04/09 | 14 | 3559 |
| Rodgers | 94.0 | 92.0 | 5 | 126.0 | 36.7 | 48 | 0 | 100 | 04/02 | 28 | 3713 |
| LA9339E26 | . | . | 2 | 144.8 | 35.9 | 40 | 0 | 100 | 04/16 | 10 | 4036 |
| LA90113AFL2-1-19-3 | . | 98.0 | 3 | 137.1 | 37.2 | 47 | 0 | 100 | 04/04 | 16 | 3520 |
| LA90104C22-7-4-1 | . | 87.9 | 4 | 129.8 | 36.3 | 43 | 0 | 100 | 04/02 | 16 | 3439 |
| Harrison | . | . | 6 | 105.3 | 37.1 | 49 | 0 | 100 | 03/30 | 21 | 3535 |
| SC910337 | . | . | 7 | 96.3 | 38.7 | 50 | 0 | 100 | 04/05 | 30 | 3478 |
| SS76-30 | . | 58.0 | 8 | 83.4 | 36.2 | 53 | 0 | 100 | 04/02 | 41 | 3284 |
| Iapar I-61 | . | 50.7 | 9 | 73.0 | 33.0 | 57 | 0 | 100 | 04/20 | 25 | 3681 |
| Average | 97.3 | 81.5 | 116.12 | 36.4 | 48 | 0 | 100 | 04/06 | 22 | 3583 | |
| LSD at 10% Level | N.S.3 | 5.3 | 8.6 | 2.0 | 3 | – | – | 04 | 15 | N.S. | |
| Std. Err. of Entry Mean | 2.6 | 2.2 | 3.6 | 0.8 | 1 | – | – | 02 | 6 | 332 | |
| 1 Yields calculated as 32 pounds per bushel at 12.5% moisture. 2 C.V. = 6.2%, and df for EMS = 24. 3 The F-test indicated no statistical difference at the alpha = 0.1 probability level; therefore, an LSD value was not calculated. Bolding indicates entries yielding equal to highest yielding entry within a column based on Fisher’s protected LSD (P = 0.10). |
|||||||||||
| Planted: | October 27, 1999. | ||||||||||
| Harvested: | May 30, 2000. | ||||||||||
| Seeding Rate: | 11 seeds per foot in 7″ rows. | ||||||||||
| Soil Type: | Cecil sandy clay loam. | ||||||||||
| Soil Test: | P = Medium, K = High, and pH = 6.5. | ||||||||||
| Fertilization: | Preplant: 28 lb N, 56 lb P2O5, and 84 lb K2O/acre. Topdress: 60 lb N/acre. |
||||||||||
| Management: | Moldboard plowed and rototilled. | ||||||||||
| Previous Crop: | Canola. | ||||||||||
| Test conducted by P. A. Rose. ( Last Updated on 8/14/00) | |||||||||||
| Oat Grain Performance, 1999-2000 Calhoun, Georgia |
||||||||||||
| Brand-Variety | Yield1 | 2000 Data | ||||||||||
| 3-Year Avg. | 2-Year Avg. | Rank | Yield (bu/ acre) |
Test Wt (lb/ bu) |
Ht (in) |
Lodg. (%) |
Winter Survival (%) |
Head Date (mo/ day) |
Bird Damage (%) |
Straw Wt (lb/ acre) |
BYD2 (%) |
|
| – bu/acre – | ||||||||||||
| Rodgers | 67.9 | 64.5 | 1 | 99.5 | 31.8 | 56 | 0 | 100 | 04/18 | 9 | 3069 | 7 |
| Horizon 314 | 63.8 | 65.5 | 2 | 96.6 | 31.5 | 53 | 0 | 100 | 04/25 | 0 | 3690 | 3 |
| LA90104C22-7-4-1 | . | 68.3 | 3 | 90.0 | 32.7 | 45 | 0 | 100 | 04/23 | 4 | 2579 | 12 |
| LA9339E26 | . | . | 4 | 89.1 | 29.2 | 44 | 0 | 100 | 04/17 | 1 | 3524 | 10 |
| LA90113AFL2-1-19-3 | . | 65.6 | 5 | 84.3 | 30.1 | 51 | 0 | 100 | 04/17 | 3 | 3107 | 8 |
| Harrison | . | . | 6 | 80.0 | 29.4 | 59 | 0 | 100 | 04/20 | 11 | 3360 | 3 |
| SC910337 | . | . | 7 | 71.5 | 31.6 | 53 | 0 | 100 | 04/06 | 5 | 3500 | 7 |
| SS76-30 | . | 38.4 | 8 | 50.8 | 29.5 | 61 | 0 | 100 | 04/19 | 23 | 2725 | 10 |
| Iapar I-61 | . | 25.5 | 9 | 35.5 | 27.4 | 64 | 91 | 100 | 04/17 | 3 | 2727 | 0 |
| Average | 65.9 | 54.6 | 77.53 | 30.3 | 54 | 10 | 100 | 04/18 | 6 | 3142 | 7 | |
| LSD at 10% Level | N.S.4 | N.S. | 8.0 | 1.4 | 2 | – | – | N.S. | 8 | N.S. | – | |
| Std. Err. of Entry Mean | 2.2 | 3.3 | 3.3 | 0.6 | 1 | – | – | 5 | 3 | 322 | – | |
| 1 Yields calculated as 32 pounds per bushel at 12.5% moisture. 2 C.V. = 8.5%, and df for EMS = 24. 3 The F-test indicated no statistical difference at the alpha = 0.1 probability level; therefore, an LSD value was not calculated. Bolding indicates entries yielding equal to highest yielding entry within a column based on Fisher’s protected LSD (P = 0.10). |
||||||||||||
| Planted: | October 22, 1999. | |||||||||||
| Harvested: | June 9, 2000. | |||||||||||
| Seeding Rate: | 11 seeds per foot in 7″ rows. | |||||||||||
| Soil Type: | Waynesboro loam. | |||||||||||
| Soil Test: | P = High, K = High, and pH = 6.3. | |||||||||||
| Fertilization: | Preplant: 20 lb N, 40 lb P2O5, and 60 lb K2O/acre. Topdress: 70 lb N/acre. |
|||||||||||
| Management: | Moldboard plowed and rototilled. | |||||||||||
| Previous Crop: | Canola. | |||||||||||
| Test conducted by P. A. Rose, G. Rawls, and J. Stubbs. (Last Updated on 8/14/00) | ||||||||||||
| Summary of Oat Yields: Georgia, 1998-2000 with Two- and Three Year Averages |
|||||||||
| Brand-Variety | Yield1 |
||||||||
| South2 | North3 | Statewide | |||||||
| 2000 | 2-Year Avg. | 3-Year Avg. | 2000 | 2-Year Avg. | 3-Year Avg. | 2000 | 2-Year Avg. | 3-Year Avg. | |
| —————————– bu/acre —————————– | |||||||||
| Chapman | 107.6 | 90.4 | 85.2 | . | . | . | . | . | . |
| Harrison | 106.0 | . | . | 92.6 | . | . | 100.6 | . | . |
| Horizon 314 | 110.2 | 93.1 | 89.9 | 122.8 | 84.1 | 86.6 | 115.2 | 89.5 | 88.7 |
| Iapar I-61 | . | . | . | 54.2 | 38.1 | . | . | . | . |
| LA90104C22-7-4-1 | 106.0 | 85.6 | . | 109.9 | 78.1 | . | 107.6 | 82.6 | . |
| LA90113AFL2-1-19-3 | 118.8 | 106.4 | . | 110.7 | 81.8 | . | 115.6 | 96.6 | . |
| LA9339E26 | 93.7 | . | . | 117.0 | . | . | 103.0 | . | . |
| Rodgers | 113.3 | 95.0 | 83.6 | 112.7 | 78.2 | 82.2 | 113.0 | 88.3 | 83.1 |
| SC910337 | 90.4 | . | . | 83.9 | . | . | 87.8 | . | . |
| Secretariat | 111.9 | 93.7 | 88.6 | . | . | . | . | . | . |
| SS76-30 | . | . | . | 67.1 | 48.2 | . | . | . | . |
| Average | 106.4 | 94.0 | 86.8 | 96.8 | 68.1 | 84.4 | 106.1 | 89.3 | 85.9 |
| LSD at 10% Level | 6.1 | 6.0 | N.S.4 | 15.7 | 10.7 | N.S. | 10.2 | 9.1 | N.S. |
| Std. Err. of Entry Mean | 3.1 | 2.7 | 2.3 | 7.2 | 4.4 | 4.0 | 5.2 | 3.9 | 3.1 |
| 1 Yields calculated at 32 pounds per bushel at 12.5% moisture. 2 Tifton, Plains, and Midville. 3 Griffin and Calhoun. 4 The F-test indicated no statistical difference at the alpha = 0.1 probability level; therefore, an LSD value was not calculated. Bolding indicates entries yielding equal to highest yielding entry within a column based on Fisher’s protected LSD (P = 0.10). Last Updated on 8/14/00 |
|||||||||
Barley
| Barley Grain Performance, 1999-2000 Plains, Georgia |
|||||||||
| Brand-Variety | Yield1 | 2000 Data | |||||||
| 3-Year Avg. | 2-Year Avg. | Rank | Yield (bu/acre) |
Test Wt (lb/bu) |
Ht (in) |
Lodg. (%) |
Winter Survival (%) |
Head Date (mo/day) |
|
| – bu/acre – | |||||||||
| GA-Luttrell | 87.0 | 92.0 | 1 | 110.6 | 44.7 | 40 | 3 | 100 | 03/23 |
| Nomini | 82.3 | 83.9 | 2 | 99.0 | 44.9 | 42 | 4 | 100 | 03/27 |
| Callao | 70.4 | 72.3 | 4 | 91.4 | 45.6 | 34 | 61 | 100 | 03/28 |
| Starling | 70.2 | 77.3 | 5 | 87.7 | 43.9 | 40 | 26 | 100 | 04/01 |
| GA-Acton | . | . | 3 | 96.0 | 41.4 | 43 | 10 | 100 | 03/29 |
| Wysor | . | . | 6 | 82.8 | 44.5 | 42 | 11 | 100 | 03/29 |
| Boone | . | . | 7 | 80.6 | 44.1 | 39 | 33 | 100 | 04/01 |
| Average | 77.5 | 81.4 | 92.62 | 44.1 | 40 | 21 | 100 | 03/29 | |
| LSD at 10% Level | 3.1 | N.S.3 | 5.4 | 1.8 | 1 | 18 | – | 01 | |
| Std. Err. of Entry Mean | 2.2 | 1.4 | 2.2 | 0.7 | 1 | 7 | – | 01 | |
| 1 Yields calculated as 48 pounds per bushel at 12.0% moisture. 2 C.V. = 4.8%, and df for EMS = 18. 3 The F-test indicated no statistical difference at the alpha = 0.1 probability level; therefore, an LSD value was not calculated. Bolding indicates entries yielding equal to highest yielding entry within a column based on Fisher’s protected LSD (P = 0.10). |
|||||||||
| Planted: | November 15, 1999. | ||||||||
| Harvested: | May 23, 2000. | ||||||||
| Seeding Rate: | 15 seeds per foot in 7″ rows. | ||||||||
| Soil Type: | Greenville sandy clay loam. | ||||||||
| Soil Test: | P = High, K = High, and pH = 6.2. | ||||||||
| Fertilization: | 9 lb N, 54 lb P2O5, and 27 lb K2O/acre. 60 lb N/acre. |
||||||||
| Management: | Subsoiled and rototilled. | ||||||||
| Previous Crop: | Peanut. | ||||||||
| Test conducted by A. E. Coy, M. D. Pippin, and R. R. Pines. (Last Updated on 8/14/00) | |||||||||
| Barley Grain Performance, 1999-2000 Calhoun, Georgia |
||||||||||
| Brand-Variety | Yield1 | 2000 Data | ||||||||
| 3-Year Avg. | 2-Year Avg. | Rank | Yield (bu/ acre) |
Test Wt (lb/ bu) |
Ht (in) |
Lodg. (%) |
Winter Survival (%) |
Head Date (mo/ day) |
Straw Wt (lb/ acre) |
|
| – bu/acre – | ||||||||||
| Starling | 72.6 | 73.5 | 1 | 76.7 | 46.6 | 39 | 0 | 100 | 04/03 | 2073 |
| Nomini | 71.5 | 76.4 | 2 | 75.4 | 47.1 | 40 | 0 | 100 | 03/30 | 1599 |
| GA-Luttrell | 71.1 | 68.2 | 5 | 67.6 | 47.1 | 38 | 3 | 100 | 03/27 | 2080 |
| Callao | 69.3 | 64.8 | 7 | 61.9 | 50.2 | 37 | 55 | 100 | 03/26 | 2367 |
| GA-Acton | . | . | 3 | 72.8 | 46.7 | 43 | 0 | 100 | 04/03 | 1980 |
| Boone | . | . | 4 | 72.1 | 47.2 | 45 | 60 | 100 | 04/03 | 2187 |
| Wysor | . | . | 6 | 65.7 | 49.0 | 41 | 0 | 100 | 03/29 | 2120 |
| Average | 71.1 | 70.7 | 70.32 | 47.7 | 40 | 17 | 100 | 03/30 | 2058 | |
| LSD at 10% Level | N.S.3 | N.S. | N.S. | 1.7 | 2 | 22 | – | 03 | N.S. | |
| Std. Err. of Entry Mean | 3.1 | 2.6 | 4.4 | 0.7 | 1 | 9 | – | 01 | 253 | |
| 1 Yields calculated as 48 pounds per bushel at 12.0% moisture. 2 C.V. = 12.5%, and df for EMS = 18. 3 The F-test indicated no statistical difference at the alpha = 0.1 probability level; therefore, an LSD value was not calculated. Bolding indicates entries yielding equal to highest yielding entry within a column based on Fisher’s protected LSD (P = 0.10). |
||||||||||
| Planted: | October 22, 1999. | |||||||||
| Harvested: | June 9, 2000. | |||||||||
| Seeding Rate: | 15 seeds per foot in 7″ rows. | |||||||||
| Soil Type: | Waynesboro loam. | |||||||||
| Soil Test: | P = High, K = High, and pH = 6.3. | |||||||||
| Fertilization: | 20 lb N, 40 lb P2O5, and 60 lb K2O/acre. 70 lb N/acre. |
|||||||||
| Management: | Moldboard plowed and rototilled. | |||||||||
| Previous Crop: | Canola. | |||||||||
| Test conducted by P. A. Rose, G. Rawls, and J. Stubbs. Last Updated on 8/14/00 | ||||||||||
| Summary of Barley Yields: Georgia, 1998-2000 with Two- and Three Year Averages |
|||||||||
| Brand-Variety | Yield1 |
||||||||
| South2 | North3 | Statewide | |||||||
| 2000 | 2-Year Avg. | 3-Year Avg. | 2000 | 2-Year Avg. | 3-Year Avg. | 2000 | 2-Year Avg. | 3-Year Avg. | |
| ——————————— bu/acre ——————————— | |||||||||
| Boone | 80.6 | . | . | 72.1 | . | . | 76.3 | . | . |
| Callao | 91.4 | 72.3 | 70.4 | 61.9 | 64.8 | 69.3 | 76.6 | 68.6 | 69.9 |
| GA-Acton | 96.0 | . | . | 72.8 | . | . | 84.4 | . | . |
| GA-Luttrell | 110.6 | 92.0 | 87.0 | 67.6 | 68.2 | 71.1 | 89.1 | 80.1 | 79.0 |
| Nomini | 99.0 | 83.9 | 82.3 | 75.4 | 76.4 | 71.5 | 87.2 | 80.2 | 76.9 |
| Starling | 87.7 | 77.3 | 70.2 | 76.7 | 73.5 | 72.6 | 82.2 | 75.4 | 71.4 |
| Wysor | 82.8 | . | . | 65.7 | . | . | 74.2 | . | . |
| Average | 92.6 | 81.4 | 77.5 | 70.3 | 70.7 | 71.1 | 81.4 | 76.1 | 74.3 |
| LSD at 10% Level | 5.4 | N.S.4 | 3.1 | N.S. | N.S. | N.S. | 5.9 | 3.6 | 3.0 |
| Std. Err. of Entry Mean | 2.2 | 1.4 | 2.2 | 4.4 | 2.6 | 3.1 | 3.5 | 1.5 | 1.2 |
| 1 Yields calculated at 48 pounds per bushel at 12.0% moisture. 2 Plains. 3 Calhoun. 4 The F-test indicated no statistical difference at the alpha = 0.1 probability level; therefore, an LSD value was not calculated. Bolding indicates entries yielding equal to highest yielding entry within a column based on Fisher’s protected LSD (P = 0.10). Last Updated on 8/14/00 |
|||||||||
Rye
| Rye Grain Performance, 1999-2000 Tifton, Georgia |
||||||||||
| Brand-Variety | Yield1 | 2000 Data | ||||||||
| 3-Year Avg. | 2-Year Avg. | Rank | Yield (bu/ acre) |
Test Wt (lb/ bu) |
Ht (in) |
Lodg. (%) |
Winter Survival (%) |
Head Date (mo/ day) |
Whole Plant Rust 4/26 (%) |
|
| – bu/acre – | ||||||||||
| Wrens 96 | 33.4 | 37.5 | 2 | 47.9 | 56.7 | 72 | 53 | 100 | 03/19 | 10 |
| Wrens Abruzzi | 31.5 | 33.3 | 5 | 37.2 | 55.2 | 65 | 86 | 100 | 03/14 | 90 |
| Bates | 30.3 | 35.3 | 1 | 49.1 | 56.0 | 66 | 63 | 100 | 03/23 | 90 |
| Wintergrazer 70 | 25.1 | 30.2 | 4 | 42.8 | 56.6 | 65 | 68 | 100 | 03/12 | 100 |
| Oklon | 24.3 | 27.4 | 6 | 36.9 | 55.9 | 66 | 68 | 100 | 03/26 | 100 |
| GI-87 | 22.4 | 29.6 | 3 | 45.1 | 56.7 | 67 | 38 | 100 | 03/24 | 90 |
| Maton | 22.3 | 21.9 | 8 | 31.7 | 55.4 | 66 | 68 | 100 | 03/26 | 80 |
| Elbon | 16.1 | 21.2 | 9 | 29.1 | 55.5 | 65 | 63 | 100 | 03/26 | 80 |
| Pennington SPIRye | . | . | 7 | 36.1 | 55.7 | 64 | 78 | 100 | 03/21 | 100 |
| Hancock | . | . | 10 | 12.0 | 48.8 | 56 | 90 | 100 | . | 100 |
| Average | 25.7 | 29.5 | 36.82 | 55.2 | 65 | 67 | 100 | 03/21 | 84 | |
| LSD at 10% Level | 3.2 | 3.0 | 5.1 | 1.4 | 2 | 27 | – | 02 | – | |
| Std. Err. of Entry Mean | 1.4 | 1.2 | 2.1 | 0.6 | 1 | 11 | – | 01 | – | |
| 1 Yields calculated as 56 pounds per bushel at 13.0% moisture. 2 C.V. = 11.5%, and df for EMS = 27. Bolding indicates entries yielding equal to highest yielding entry within a column based on Fisher’s protected LSD (P = 0.10). |
||||||||||
| Planted: | November 16, 1999. | |||||||||
| Harvested: | May 30, 2000. | |||||||||
| Seeding Rate: | 18 seeds per foot in 7″ rows. | |||||||||
| Soil Type: | Tifton loamy sand. | |||||||||
| Soil Test: | P = High, K = Medium, and pH = 5.7. | |||||||||
| Fertilization: | Preplant: 40 lb N, 40 lb P2O5, and 40 lb K2O/acre. Topdress: 40 lb N/acre. |
|||||||||
| Management: | Moldboard plowed and rototilled. | |||||||||
| Previous Crop: | Cotton. | |||||||||
| Test conducted by A. E. Coy and M. D. Pippin. Last Updated on 8/14/00 | ||||||||||
| Rye Grain Performance, 1999-2000 Griffin, Georgia |
||||||||||
| Brand-Variety | Yield1 | 2000 Data | ||||||||
| 3-Year Avg. | 2-Year Avg. | Rank | Yield (bu/ acre) |
Test Wt (lb/ bu) |
Ht (in) |
Lodg. (%) |
Winter Survival (%) |
Head Date (mo/ day) |
Straw Wt (lb/ acre) |
|
| – bu/acre – | ||||||||||
| Wintergrazer 70 | 49.1 | 56.4 | 1 | 65.0 | 57.0 | 64 | 18 | 100 | 03/10 | 2631 |
| Wrens Abruzzi | 46.6 | 55.2 | 2 | 61.5 | 56.4 | 62 | 78 | 100 | 03/10 | 2945 |
| Bates | 43.9 | 49.9 | 7 | 46.8 | 55.5 | 62 | 60 | 100 | 03/16 | 2821 |
| Oklon | 43.7 | 48.8 | 4 | 51.8 | 56.1 | 58 | 48 | 100 | 03/23 | 3084 |
| GI-87 | 43.1 | 49.0 | 5 | 50.1 | 56.2 | 60 | 40 | 100 | 03/23 | 2690 |
| Wrens 96 | 41.6 | 49.2 | 3 | 54.0 | 56.3 | 67 | 63 | 100 | 03/12 | 3213 |
| Maton | 38.1 | 41.4 | 9 | 39.0 | 55.6 | 60 | 60 | 100 | 03/24 | 2461 |
| Elbon | 34.2 | 37.1 | 10 | 34.1 | 55.1 | 59 | 65 | 100 | 03/24 | 2113 |
| Pennington SPIRye | . | . | 6 | 48.9 | 56.8 | 59 | 41 | 100 | 03/14 | 2751 |
| Hancock | . | . | 8 | 40.9 | 52.1 | 55 | 43 | 100 | 04/19 | 2030 |
| Average | 42.5 | 48.4 | 49.22 | 55.7 | 60 | 51 | 100 | 03/20 | 2674 | |
| LSD at 10% Level | 3.9 | N.S.3 | 6.9 | 0.8 | 3 | 29 | – | 01 | 508 | |
| Std. Err. of Entry Mean | 1.6 | 2.1 | 2.9 | 0.3 | 1 | 12 | – | 01 | 211 | |
| 1 Yields calculated as 56 pounds per bushel at 13.0% moisture. 2 C.V. = 11.7%, and df for EMS = 27. 3 The F-test indicated no statistical difference at the alpha = 0.1 probability level; therefore, an LSD value was not calculated. Bolding indicates entries yielding equal to highest yielding entry within a column based on Fisher’s protected LSD (P = 0.10). |
||||||||||
| Planted: | October 27, 1999. | |||||||||
| Harvested: | June 8, 2000. | |||||||||
| Seeding Rate: | 18 seeds per foot in 7″ rows. | |||||||||
| Soil Type: | Cecil sandy clay loam. | |||||||||
| Soil Test: | P = Medium, K = High, and pH =6.5 . | |||||||||
| Fertilization: | 28 lb N, 56 lb P2O5, and 84 lb K2O/acre. 60 lb N/acre. |
|||||||||
| Management: | Moldboard plowed and rototilled. | |||||||||
| Previous Crop: | Canola. | |||||||||
| Test conducted by P. A. Rose. Last Updated on 8/14/00 | ||||||||||
| Summary of Rye Yields: Georgia, 1998-2000 with Two- and Three Year Averages |
|||||||||
| Brand-Variety | Yield1 ————————– bu/acre ————————– |
||||||||
| South2 | North3 | Statewide | |||||||
| 2000 | 2-Year Avg. | 3-Year Avg. | 2000 | 2-Year Avg. | 3-Year Avg. | 2000 | 2-Year Avg. | 3-Year Avg. | |
| Bates | 49.1 | 35.3 | 30.3 | 46.8 | 49.9 | 43.9 | 47.9 | 42.6 | 37.1 |
| Elbon | 29.1 | 21.2 | 16.1 | 34.1 | 37.1 | 34.2 | 31.6 | 29.1 | 25.2 |
| GI-87 | 45.1 | 29.6 | 22.4 | 50.1 | 49.0 | 43.1 | 47.6 | 39.3 | 32.7 |
| Hancock | 12.0 | . | . | 40.9 | . | . | 26.4 | . | . |
| Maton | 31.7 | 21.9 | 22.3 | 39.0 | 41.4 | 38.1 | 35.3 | 31.6 | 30.2 |
| Oklon | 36.9 | 27.4 | 24.3 | 51.8 | 48.8 | 43.7 | 44.4 | 38.1 | 34.0 |
| Pennington SPIRye | 36.1 | . | . | 48.9 | . | . | 42.5 | . | . |
| Wintergrazer 70 | 42.8 | 30.2 | 25.1 | 65.0 | 56.4 | 49.1 | 53.9 | 43.3 | 37.1 |
| Wrens 96 | 47.9 | 37.5 | 33.4 | 54.0 | 49.2 | 41.6 | 50.9 | 43.3 | 37.5 |
| Wrens Abruzzi | 37.2 | 33.3 | 31.5 | 61.5 | 55.2 | 46.6 | 49.4 | 44.2 | 39.0 |
| Average | 36.8 | 29.6 | 25.7 | 49.2 | 48.4 | 42.5 | 43.0 | 38.9 | 34.1 |
| LSD at 10% Level | 5.1 | 3.0 | 3.2 | 6.9 | N.S.4 | 3.9 | 4.2 | 3.0 | 2.2 |
| Std. Err. of Entry Mean | 2.1 | 1.2 | 1.4 | 2.9 | 2.1 | 1.6 | 2.5 | 1.2 | 1.3 |
| 1 Yields calculated at 56 pounds per bushel at 13.0% moisture. 2 Tifton. 3 Griffin. 4 The F-test indicated no statistical difference at the alpha = 0.1 probability level; therefore, an LSD value was not calculated. Bolding indicates entries yielding equal to highest yielding entry within a column based on Fisher’s protected LSD (P = 0.10). Last Updated on 8/14/00 |
|||||||||
Forage Test Results
Wheat
| Wheat Forage Performance, 1999-2000 Tifton, Georgia |
|||||||
| Brand-Variety | Dry Matter Yield | ||||||
| Harvest Date | Season Totals | ||||||
| 1-03-00 | 2-01-00 | 2-23-00 | 3-14-00 | 4-04-00 | 2000 | 2-Yr Avg | |
| ——————————- lb/acre ——————————- | |||||||
| Roane | 1409 | 1220 | 1038 | 1481 | 2214 | 7362 | 6944 |
| Jackson | 1612 | 1213 | 1220 | 1380 | 1657 | 7081 | 7235 |
| AR 584A-3-1 | 1409 | 1162 | 1169 | 1401 | 1880 | 7021 | . |
| Roberts | 1648 | 1169 | 1147 | 1416 | 1626 | 7006 | 7031 |
| VA96W-158 | 1735 | 1387 | 1227 | 1510 | 1016 | 6875 | . |
| AR 494B-2-2 | 1602 | 1235 | 1343 | 1467 | 915 | 6561 | . |
| FFF Exp. 2704 | 1423 | 1177 | 1075 | 1423 | 1452 | 6549 | . |
| AGS 2000 | 1859 | 1206 | 1293 | 1271 | 791 | 6418 | 6451 |
| FFR566 | 1358 | 1147 | 1104 | 1474 | 1300 | 6382 | . |
| Pioneer 2691 | 1517 | 1264 | 1401 | 1067 | 987 | 6236 | 6287 |
| LA90144B16-3-2 | 1634 | 1351 | 1488 | 1118 | 639 | 6230 | . |
| Jaypee | 1510 | 1213 | 1314 | 1372 | 809 | 6219 | 6191 |
| VA96W-270 | 1307 | 1118 | 1111 | 1633 | 1038 | 6207 | . |
| NK Coker 9663 | 1590 | 1184 | 1423 | 958 | 980 | 6135 | . |
| LA9070G45-3-3-1 | 1488 | 1271 | 1329 | 1009 | 951 | 6048 | . |
| UGA90524E35 | 1626 | 1198 | 1365 | 1038 | 748 | 5975 | . |
| Pioneer 2684 | 1074 | 1118 | 1336 | 1648 | 777 | 5953 | 6109 |
| NK Coker 9835 | 1394 | 1249 | 1394 | 929 | 879 | 5845 | . |
| AgriPro Mason | 1525 | 1314 | 1278 | 965 | 632 | 5714 | 6066 |
| Average | 1511 | 1221 | 1266 | 1293 | 1121 | 64111 | 6539 |
| LSD at 10% Level | 217 | 72 | 109 | 120 | 196 | 282 | 226 |
| Std. Err. of Entry Mean | 92 | 30 | 46 | 51 | 83 | 120 | 95 |
| 1 C.V. = 3.7%, and df for EMS = 54.
Bolding indicates entries yielding equal to highest yielding entry within a column based on Fisher’s protected LSD (P = 0.10). |
|||||||
| Planted: | October 26, 1999. | ||||||
| Seeding Rate: | 27 seed/foot in 7″ rows. | ||||||
| Soil Type: | Tifton loamy sand. | ||||||
| Soil Test: | P = High, K = Medium, and pH = 5.7. | ||||||
| Fertilization: | 93 lb N, 50 lb P2O5, and 75 lb K2O/acre. 40 lb N/acre after 1st, 2nd, 3rd, and 4th harvests. |
||||||
| Management: | Moldboard plowed and rototilled. | ||||||
| Previous Crop: | Millet forage. | ||||||
| Test conducted by A. E. Coy and M. D. Pippin. Last Updated on 8/14/00 | |||||||
| Wheat Forage Performance, 1999-2000 Plains, Georgia |
||||||
| Brand-Variety | Dry Matter Yield | |||||
| Harvest Date | Season Totals | |||||
| 1-18-00 | 2-28-00 | 3-24-00 | 5-04-00 | 2000 | 2-Yr Avg | |
| ————————– lb/acre ————————– | ||||||
| Roane | 784 | 965 | 2698 | 2352 | 6799 | 6449 |
| AR 494B-2-2 | 1350 | 1539 | 2018 | 1590 | 6497 | . |
| AR 584A-3-1 | 733 | 1205 | 2221 | 2055 | 6215 | . |
| AGS 2000 | 1220 | 1525 | 1678 | 1742 | 6165 | 5794 |
| LA90144B16-3-2 | 995 | 1873 | 1256 | 1859 | 5983 | . |
| NK Coker 9835 | 929 | 1692 | 1355 | 2004 | 5980 | . |
| VA96W-270 | 501 | 1162 | 2639 | 1677 | 5979 | . |
| Roberts | 1154 | 1235 | 2140 | 1438 | 5966 | 6135 |
| UGA90524E35 | 1321 | 1626 | 1380 | 1496 | 5822 | . |
| Pioneer 2684 | 668 | 1474 | 1986 | 1488 | 5616 | 5402 |
| VA96W-158 | 951 | 1314 | 1809 | 1292 | 5367 | . |
| Pioneer 2691 | 450 | 1583 | 726 | 1989 | 4748 | 4585 |
| Jackson | 376 | 1002 | 958 | 2149 | 4485 | 4581 |
| AgriPro Mason | 922 | 1242 | 791 | 1452 | 4407 | 4414 |
| LA9070G45-3-3-1 | 770 | 1264 | 799 | 1489 | 4320 | . |
| Jaypee | 298 | 1111 | 922 | 1917 | 4247 | 4277 |
| NK Coker 9663 | 421 | 1300 | 567 | 1874 | 4161 | . |
| Average | 814 | 1359 | 1526 | 1757 | 54561 | 5205 |
| LSD at 10% Level | 318 | 155 | 154 | 353 | 486 | 267 |
| Std. Err. of Entry Mean | 134 | 65 | 65 | 149 | 205 | 112 |
| 1 C.V. = 7.5%, and df for EMS = 48.
Bolding indicates entries yielding equal to highest yielding entry within a column based on Fisher’s protected LSD (P = 0.10). |
||||||
| Planted: | October 27, 1999. | |||||
| Seeding Rate: | 27 seed/foot in 7″ rows. | |||||
| Soil Type: | Greenville sandy clay loam. | |||||
| Soil Test: | P = Medium, K = High, and pH = 5.6. | |||||
| Fertilization: | 62 lb N, 72 lb P2O5, and 36 lb K2O/acre. 50 lb N/acre after 1st, 2nd, and 3rd harvests. |
|||||
| Management: | Subsoiled and rototilled. | |||||
| Previous Crop: | Small grain – Grain. | |||||
| Test conducted by A. E. Coy, M. D. Pippin, and R. R. Pines. Last Updated on 8/14/00 | ||||||
| Wheat Forage Performance, 1999-2000 Griffin, Georgia |
||||||
| Brand-Variety | Dry Matter Yield | |||||
| Harvest Date | Season Totals | |||||
| 12-15-99 | 2-16-00 | 3-08-00 | 4-07-00 | 2000 | 2-Yr Avg. | |
| ——————————- lb/acre ——————————- | ||||||
| VA96W-158 | 1473 | 2355 | 1561 | 2383 | 7772 | . |
| NK Coker 9835 | 1164 | 2827 | 1129 | 2569 | 7689 | . |
| Roberts | 1555 | 1623 | 1415 | 2936 | 7527 | 7403 |
| AGS 2000 | 1444 | 2254 | 1226 | 2554 | 7478 | 6953 |
| AR 494B-2-2 | 998 | 2627 | 1775 | 1964 | 7364 | . |
| LA9070G45-3-3-1 | 803 | 2669 | 1243 | 2595 | 7310 | . |
| Pioneer 2691 | 1188 | 2409 | 1242 | 2464 | 7302 | 6722 |
| Roane | 1241 | 1197 | 1431 | 3430 | 7298 | 6603 |
| AgriPro Mason | 1375 | 2608 | 1080 | 2205 | 7267 | 6835 |
| LA90144B16-3-2 | 1038 | 2707 | 1089 | 2414 | 7247 | . |
| AR 584A-3-1 | 1013 | 1857 | 1445 | 2798 | 7112 | . |
| UGA90524E35 | 1144 | 2704 | 1000 | 2240 | 7089 | . |
| NK Coker 9704 | 652 | 1850 | 1521 | 3058 | 7080 | . |
| NK Coker 9663 | 814 | 2102 | 1348 | 2410 | 6673 | . |
| Jaypee | 913 | 1950 | 1589 | 2214 | 6665 | 6310 |
| Pioneer 2684 | 803 | 2029 | 1951 | 1836 | 6618 | 6563 |
| Jackson | 776 | 1619 | 1634 | 2549 | 6578 | 6603 |
| FFR566 | 764 | 1639 | 1653 | 2501 | 6556 | . |
| AgriPro Hickory | 985 | 1710 | 1668 | 2174 | 6537 | 6394 |
| FFF Exp. 2704 | 766 | 1460 | 1620 | 2646 | 6492 | . |
| VA96W-270 | 1156 | 1449 | 1688 | 2087 | 6379 | . |
| NK Coker 9803 | 811 | 1103 | 1654 | 2608 | 6175 | . |
| Average | 1040 | 2034 | 1453 | 2483 | 70091 | 6709 |
| LSD at 10% Level | 210 | 420 | 174 | 390 | 562 | N.S.2 |
| Std. Err. of Entry Mean | 89 | 178 | 74 | 165 | 238 | 129 |
| 1 C.V. = 6.8%, and df for EMS = 63. 2 The F-test indicated no statistical difference at the alpha = 0.1 probability level; therefore an LSD value was not calculated. Bolding indicates entries yielding equal to highest yielding entry within a column based on Fisher’s protected LSD (P = 0.10). |
||||||
| Planted: | October 4, 1999. | |||||
| Seeding Rate: | 27 seed/foot in 7″ rows. | |||||
| Soil Type: | Cecil sandy clay loam. | |||||
| Soil Test: | P = High, K = High, and pH = 6.3. | |||||
| Fertilization: | 49 lb N, 98 lb P2O5, and 147 lb K2O/acre. 50 lb N/acre after 1st, 2nd, and 3rd harvests. |
|||||
| Management: | Moldboard plowed and rototilled. | |||||
| Previous Crop: | Canola. | |||||
| Test conducted by P. A. Rose. Last Updated on 8/14/00 | ||||||
| Wheat Forage Performance, 1999-2000 Quincy, Florida |
|||||
| Brand-Variety | Dry Matter Yield | ||||
| Harvest Date | Season Total | ||||
| 12-08-99 | 1-11-00 | 2-20-00 | 3-28-00 | 2000 | |
| ————————– lb/acre ————————– | |||||
| VA96W-270 | 740 | 1252 | 2370 | 7517 | 11878 |
| Roberts | 1196 | 1561 | 2096 | 6581 | 11433 |
| AR 494B-2-2 | 1298 | 1434 | 2465 | 6227 | 11423 |
| FFR566 | 955 | 1445 | 2169 | 6753 | 11321 |
| Roane | 898 | 1460 | 2020 | 6918 | 11295 |
| VA96W-158 | 1263 | 1492 | 2081 | 6230 | 11066 |
| Pioneer 2684 | 971 | 1185 | 2422 | 6255 | 10833 |
| Jaypee | 828 | 1437 | 2760 | 5666 | 10691 |
| AR 584A-3-1 | 1032 | 1458 | 2365 | 5713 | 10567 |
| Jackson | 1170 | 1453 | 2290 | 5624 | 10536 |
| FFF Exp. 2704 | 842 | 1463 | 1875 | 6227 | 10407 |
| AGS 2000 | 1008 | 1417 | 2785 | 5049 | 10259 |
| Pioneer 2691 | 1154 | 1442 | 2893 | 3974 | 9463 |
| AgriPro Mason | 1364 | 1509 | 3173 | 2733 | 8779 |
| LA9070G45-3-3-1 | 1037 | 1371 | 2758 | 3152 | 8318 |
| LA90144B16-3-2 | 875 | 1331 | 3323 | 2773 | 8303 |
| NK Coker 9835 | 868 | 1266 | 3630 | 2495 | 8258 |
| UGA90524E35 | 1154 | 1452 | 3067 | 1986 | 7658 |
| NK Coker 9663 | 1074 | 1388 | 2833 | 1318 | 6612 |
| Average | 1038 | 1411 | 2599 | 4905 | 99531 |
| LSD at 10% Level | 245 | 246 | 572 | 807 | 814 |
| Std. Err. of Entry Mean | 103 | 104 | 142 | 341 | 344 |
| 1. C.V. = 6.9%, and df for EMS = 54.
Bolding indicates entries yielding equal to highest yielding entry within a column based on Fisher’s protected LSD (P = 0.10). |
|||||
| Planted: | October 22, 1999. | ||||
| Seeding Rate: | 27 seed/foot in 7″ rows. | ||||
| Soil Type: | Dothan loamy fine sand. | ||||
| Soil Test: | P = High, K = High, and pH = 6.3. | ||||
| Fertilization: | 40 lb N, 0 lb P2O5, and 0 lb K2O/acre. 50 lb N/acre after 1st, 2nd, and 3rd harvests. |
||||
| Management: | Moldboard plowed and rototilled. | ||||
| Previous Crop: | Summer fallow. | ||||
| Test conducted by A. R. Blount and A. W. Watson. Last Updated on 8/14/00 | |||||
| Statewide Summary: Wheat Forage Performance, 1998-2000 with Two- and Three-Year Averages |
|||||||||
| Brand-Variety | Dry Forage Yield | ||||||||
| Tifton | Plains | Griffin | Statewide | ||||||
| 2000 | 3-Year Avg. | 2000 | 3-Year Avg. | 2000 | 3-Year Avg. | 2000 | 2-Year Avg. | 3-Year Avg. | |
| ——————————- lb/acre ——————————- | |||||||||
| AGS 2000 | 6418 | . | 6165 | . | 7478 | . | 6687 | 6399 | . |
| AR 494B-2-2 | 6561 | . | 6497 | . | 7364 | . | 6807 | . | . |
| AR 584A-3-1 | 7021 | . | 6215 | . | 7112 | . | 6783 | . | . |
| AgriPro Hickory | . | . | . | . | 6537 | . | . | . | . |
| AgriPro Mason | 5714 | . | 4407 | . | 7267 | . | 5796 | 5771 | . |
| FFF Exp. 2704 | 6549 | . | . | . | 6492 | . | . | . | . |
| FFR566 | 6382 | . | . | . | 6556 | . | . | . | . |
| Jackson | 7081 | 6686 | 4485 | 4237 | 6578 | 6509 | 6048 | 6140 | 5810 |
| Jaypee | 6219 | 5847 | 4247 | 3867 | 6665 | 6306 | 5710 | 5593 | 5340 |
| LA90144B16-3-2 | 6230 | . | 5983 | . | 7247 | . | 6486 | . | . |
| LA9070G45-3-3-1 | 6048 | . | 4320 | . | 7310 | . | 5893 | . | . |
| NK Coker 9663 | 6135 | . | 4161 | . | 6673 | . | 5656 | . | . |
| NK Coker 9704 | . | . | . | . | 7080 | . | . | . | . |
| NK Coker 9803 | . | . | . | . | 6175 | . | . | . | . |
| NK Coker 9835 | 5845 | . | 5980 | . | 7689 | . | 6504 | . | . |
| Pioneer 2684 | 5953 | 5667 | 5616 | 4770 | 6618 | 6275 | 6062 | 6025 | 5571 |
| Pioneer 2691 | 6236 | 5769 | 4748 | 4114 | 7302 | 6465 | 6095 | 5864 | 5449 |
| Roane | 7362 | . | 6799 | . | 7298 | . | 7153 | 6665 | . |
| Roberts | 7006 | 6608 | 5966 | 5493 | 7527 | 6971 | 6833 | 6856 | 6357 |
| UGA90524E35 | 5975 | . | 5822 | . | 7089 | . | 6295 | . | . |
| VA96W-158 | 6875 | . | 5367 | . | 7772 | . | 6671 | . | . |
| VA96W-270 | 6207 | . | 5979 | . | 6379 | . | 6188 | . | . |
| Average | 6411 | 6116 | 5456 | 4496 | 7009 | 6505 | 6333 | 6164 | 5706 |
| LSD at 10% Level | 282 | 243 | 486 | 242 | 562 | 343 | 741 | 184 | 158 |
| Std. Err. of Entry Mean | 120 | 85 | 205 | 85 | 238 | 120 | 192 | 114 | 98 |
| Bolding indicates entries yielding equal to highest yielding entry within a column based on Fisher’s protected LSD (P = 0.10). Last Updated on 8/14/00 | |||||||||
Oat
| Oat Forage Performance, 1999-2000 Tifton, Georgia |
||||||||
| Brand-Variety | Dry Matter Yield | |||||||
| Harvest Date | Season Totals | |||||||
| 1-03-00 | 2-01-00 | 2-23-00 | 3-14-00 | 4-04-00 | 4-21-00 | 2000 | 2-Yr Avg | |
| ——————————- lb/acre ——————————- | ||||||||
| NK-Coker 227 | 1655 | 1024 | 1256 | 1517 | 1532 | 421 | 7405 | 6835 |
| Harrison | 1467 | 1104 | 1264 | 1365 | 1597 | 385 | 7181 | 7006 |
| Secretariat | 1488 | 1053 | 1118 | 1517 | 1546 | 436 | 7158 | 6697 |
| SS76-30 | 1532 | 1126 | 1227 | 1452 | 1336 | 392 | 7064 | 6661 |
| SC910337 | 1554 | 907 | 1249 | 1481 | 1387 | 356 | 6933 | . |
| Horizon 314 | 1663 | 973 | 1053 | 1322 | 1517 | 370 | 6897 | 6552 |
| Rodgers | 1844 | 922 | 1060 | 1256 | 1423 | 378 | 6883 | 6719 |
| Arkansas Co. 604 | 1234 | 987 | 1133 | 1517 | 1365 | 421 | 6657 | 6487 |
| Chapman | 1525 | 987 | 1125 | 1213 | 1329 | 305 | 6483 | 6385 |
| Iapar I-61 | 1685 | 356 | 494 | 1002 | 1350 | 356 | 5242 | 4687 |
| Average | 1565 | 944 | 1098 | 1364 | 1438 | 382 | 67901 | 6448 |
| LSD at 10% Level | 203 | 68 | 142 | 125 | N.S.2 | N.S. | 412 | 304 |
| Std. Err. of Entry Mean | 84 | 28 | 59 | 52 | 78 | 47 | 171 | 128 |
| 1 C.V. = 5.0%, and df for EMS = 27. 2 The F-test indicated no statistical difference at the alpha = 0.1 probability level; therefore an LSD value was not calculated. Bolding indicates entries yielding equal to highest yielding entry within a column based on Fisher’s protected LSD (P = 0.10). |
||||||||
| Planted: | October 26, 1999. | |||||||
| Seeding Rate: | 22 seed/foot in 7″ rows. | |||||||
| Soil Type: | Tifton loamy sand. | |||||||
| Soil Test: | P = High, K = Medium, and pH = 5.7. | |||||||
| Fertilization: | 93 lb N, 50 lb P2O5, and 75 lb K2O/acre. 40 lb N/acre after 1st, 2nd, 3rd, 4th, and 5th harvests. |
|||||||
| Management: | Moldboard plowed and rototilled. | |||||||
| Previous Crop: | Millet forage. | |||||||
| Test conducted by A. E. Coy and M. D. Pippin. Last Updated on 8/14/00 | ||||||||
| Oat Forage Performance, 1999-2000 Plains, Georgia |
||||||
| Brand-Variety | Dry Matter Yield | |||||
| Harvest Date | Season Totals | |||||
| 1-18-00 | 2-28-00 | 3-24-00 | 5-04-00 | 2000 | 2-Yr Avg | |
| ——————————- lb/acre ——————————- | ||||||
| NK-Coker 227 | 1256 | 1532 | 2082 | 3427 | 8296 | 7299 |
| Rodgers | 1358 | 1067 | 1861 | 3725 | 8010 | 7149 |
| Secretariat | 1220 | 1401 | 1937 | 3441 | 7998 | 7099 |
| Horizon 314 | 1293 | 1394 | 2062 | 2984 | 7732 | 7000 |
| Harrison | 1060 | 1517 | 2128 | 2934 | 7639 | 7091 |
| SC910337 | 1075 | 1445 | 1864 | 3144 | 7527 | . |
| Arkansas Co. 604 | 755 | 1438 | 2141 | 3093 | 7427 | 6723 |
| SS76-30 | 820 | 1532 | 2205 | 2563 | 7120 | 6439 |
| Chapman | 1184 | 1184 | 1798 | 2803 | 6968 | 6297 |
| Iapar I-61 | 1358 | 58 | 0 | 0 | 1416 | 2278 |
| Average | 1138 | 1257 | 2009 | 3124 | 70131 | 6375 |
| LSD at 10% Level | 327 | 157 | 257 | 481 | 700 | 320 |
| Std. Err. of Entry Mean | 136 | 66 | 105 | 199 | 290 | 135 |
| 1 C.V. = 7.4%, and df for EMS = 27.
Bolding indicates entries yielding equal to highest yielding entry within a column based on Fisher’s protected LSD (P = 0.10). |
||||||
| Planted: | October 27, 1999. | |||||
| Seeding Rate: | 22 seed/foot in 7″ rows. | |||||
| Soil Type: | Greenville sandy clay loam. | |||||
| Soil Test: | P = Medium, K = High, and pH = 5.6. | |||||
| Fertilization: | 62 lb N, 72 lb P2O5, and 36 lb K2O/acre. 50 lb N/acre after 1st, 2nd, and 3rd harvests. |
|||||
| Management: | Small grain – Grain. | |||||
| Previous Crop: | Subsoiled and rototilled. | |||||
| Test conducted by A. E. Coy, M. D. Pippin, and R. R. Pines. Last Updated on 8/14/00 | ||||||
| Oat Forage Performance, 1999-2000 Griffin, Georgia |
||||||
| Brand-Variety | Dry Matter Yield | |||||
| Harvest Date | Season Totals | |||||
| 12-08-99 | 2-15-00 | 3-08-00 | 4-06-00 | 2000 | 2-Yr Avg | |
| ——————————- lb/acre ——————————- | ||||||
| Rodgers | 2279 | 1652 | 1236 | 3040 | 8207 | 8445 |
| NK-Coker 227 | 1865 | 1684 | 1587 | 2691 | 7827 | . |
| SC910337 | 1528 | 2145 | 1296 | 2759 | 7727 | . |
| Arkansas Co. 604 | 1651 | 1860 | 1245 | 2859 | 7614 | 7634 |
| Harrison | 2053 | 1515 | 1108 | 2735 | 7410 | 7759 |
| Horizon 314 | 1919 | 1639 | 1184 | 2585 | 7327 | 7790 |
| SS76-30 | 1404 | 1362 | 1659 | 2651 | 7075 | 7859 |
| Chapman | 1627 | 1808 | 1095 | 2368 | 6899 | 6900 |
| Iapar I-61 | 2278 | 871 | 505 | 2454 | 6107 | 5340 |
| Average | 1845 | 1615 | 1213 | 2682 | 73551 | 7390 |
| LSD at 10% Level | 397 | 374 | 159 | 253 | 589 | 402 |
| Std. Err. of Entry Mean | 164 | 154 | 66 | 104 | 243 | 163 |
| 1 C.V. = 6.6%, and df for EMS = 24.
Bolding indicates entries yielding equal to highest yielding entry within a column based on Fisher’s protected LSD (P = 0.10). |
||||||
| Planted: | October 4, 1999. | |||||
| Seeding Rate: | 22 seed/foot in 7″ rows. | |||||
| Soil Type: | Cecil sandy clay loam. | |||||
| Soil Test: | P = High, K = High, and pH = 6.3. | |||||
| Fertilization: | 49 lb N, 98 lb P2O5, and 147 lb K2O/acre. 50 lb N/acre after 1st, 2nd, and 3rd harvests. |
|||||
| Management: | Moldboard plowed and rototilled. | |||||
| Previous Crop: | Canola. | |||||
| Test conducted by P. A. Rose. Last Updated on 8/14/00 | ||||||
| Oat Forage Performance, 1999-2000 Quincy, Florida |
||||||
| Brand-Variety | Dry Matter Yield | |||||
| Harvest Date | Season Total | Cold | ||||
| 12-08-99 | 1-11-00 | 2-16-00 | 3-28-00 | 2000 | Damage | |
| ————————– lb/acre ————————– | % | |||||
| Rodgers | 774 | 1966 | 970 | 7975 | 11684 | 10 |
| Secretariat | 1189 | 1530 | 1219 | 7441 | 11378 | 5 |
| NK-Coker 227 | 971 | 1544 | 1304 | 7419 | 11237 | 5 |
| SS76-30 | 866 | 1999 | 710 | 7629 | 11204 | 5 |
| Harrison | 896 | 1422 | 1058 | 7676 | 11052 | 5 |
| Horizon 314 | 702 | 1702 | 1111 | 7186 | 10702 | 5 |
| Arkansas Co. 604 | 600 | 1418 | 1127 | 6848 | 9992 | 5 |
| Chapman | 686 | 1854 | 987 | 6173 | 9699 | 11 |
| SC910337 | 633 | 1557 | 1367 | 5510 | 9065 | 1 |
| Iapar I-61 | 1387 | 1603 | 0 | 2181 | 5171 | 50 |
| Average | 870 | 1659 | 1095 | 6604 | 101181 | 10 |
| LSD at 10% Level | 313 | 270 | 239 | 1022 | 1232 | N.S.2 |
| Std. Err. of Entry Mean | 130 | 112 | 99 | 424 | 512 | 0.7 |
| 1 C.V. = 10.1%, and df for EMS = 27. 2 The F-test indicated no statistical difference at the alpha = 0.1 probability level; therefore an LSD value was not calculated. Bolding indicates entries yielding equal to highest yielding entry within a column based on Fisher’s protected LSD (P = 0.10). |
||||||
| Planted: | October 22, 1999. | |||||
| Seeding Rate: | 22 seed/foot in 7″ rows. | |||||
| Soil Type: | Dothan loamy fine sand. | |||||
| Soil Test: | P = High, K = High, and pH = 6.3. | |||||
| Fertilization: | 40 lb N, 0 lb P2O5, and 0 lb K2O/acre. 50 lb N/acre after 1st, 2nd, and 3rd harvests. |
|||||
| Management: | Moldboard plowed and rototilled. | |||||
| Previous Crop: | Summer fallow. | |||||
| Test conducted by A. R. Blount and A. W. Watson. Last Updated on 8/14/00 | ||||||
| Statewide Summary: Oat Forage Performance, 1998-2000 with Two- and Three-Year Averages |
|||||||||
| Brand-Variety | Dry Forage Yield | ||||||||
| Tifton | Plains | Griffin | Statewide | ||||||
| 2000 | 3-Year Avg. | 2000 | 3-Year Avg. | 2000 | 3-Year Avg. | 2000 | 2-Year Avg. | 3-Year Avg. | |
| ——————————- lb/acre ——————————- | |||||||||
| Arkansas Co. 604 | 6657 | 6260 | 7427 | 6209 | 7614 | 6884 | 7233 | 6948 | 6451 |
| Chapman | 6483 | 6123 | 6968 | 5860 | 6899 | 6357 | 6783 | 6527 | 6113 |
| Harrison | 7181 | 6659 | 7639 | 6572 | 7410 | 7121 | 7410 | 7285 | 6784 |
| Horizon 314 | 6897 | 6409 | 7732 | 6465 | 7327 | 7186 | 7319 | 7114 | 6687 |
| Iapar I-61 | 5242 | . | 1416 | . | 6107 | . | 4255 | 4102 | . |
| NK-Coker 227 | 7405 | 6567 | 8296 | 6630 | 7827 | . | 7843 | . | . |
| Rodgers | 6883 | 6590 | 8010 | 6621 | 8207 | 7915 | 7700 | 7438 | 7042 |
| SC910337 | 6933 | . | 7527 | . | 7727 | . | 7396 | . | . |
| SS76-30 | 7064 | . | 7120 | . | 7075 | . | 7087 | 6986 | . |
| Secretariat | 7158 | . | 7998 | . | . | . | . | . | . |
| Average | 6790 | 6435 | 7013 | 6393 | 7355 | 7093 | 7003 | 6629 | 6615 |
| LSD at 10% Level | 412 | 274 | 700 | 317 | 589 | 449 | 1312 | 242 | 202 |
| Std. Err. of Entry Mean | 171 | 96 | 290 | 111 | 243 | 149 | 232 | 149 | 123 |
| Bolding indicates entries yielding equal to highest yielding entry within a column based on Fisher’s protected LSD (P = 0.10). Last Updated on 8/14/00 | |||||||||
Rye
| Rye Forage Performance, 1999-2000 Tifton, Georgia |
|||||||||
| Brand-Variety | Dry Matter Yield | ||||||||
| Harvest Date | |||||||||
| 1-03-00 | 2-01-00 | 2-22-00 | Total First 3 Harv. | 2-Yr Avg First 3 Harv. | 3-10-00 | 4-03-00 | Season Totals | ||
| 2000 | 2-Yr Avg | ||||||||
| ——————————- lb/acre ——————————- | |||||||||
| Wintermore | 1757 | 1220 | 1423 | 4400 | 3623 | 1583 | 1423 | 7405 | 7398 |
| AgrioBioTech XR9902 | 1793 | 1198 | 1351 | 4342 | . | 1648 | 1387 | 7376 | . |
| AgrioBioTech XR9903 | 1713 | 1220 | 1394 | 4327 | . | 1525 | 1365 | 7217 | . |
| Bates | 1576 | 1256 | 1474 | 4306 | 3605 | 1488 | 1300 | 7094 | 7162 |
| FL98RP21 | 1633 | 1220 | 1452 | 4305 | 3714 | 1380 | 1242 | 6927 | 7202 |
| Pennington SPIRye | 1677 | 1191 | 1423 | 4291 | . | 1626 | 1303 | 7220 | . |
| Wheeler | 1793 | 1184 | 1271 | 4248 | 3478 | 1452 | 1380 | 7080 | 6996 |
| FL98RP13 | 1605 | 1191 | 1445 | 4240 | 3565 | 1358 | 1321 | 6919 | 6992 |
| AgrioBioTech XR9909 | 1692 | 1177 | 1365 | 4233 | . | 1474 | 1307 | 7014 | . |
| AgrioBioTech XR9907 | 1677 | 1155 | 1401 | 4233 | . | 1488 | 1234 | 6956 | . |
| FL98RP10 | 1677 | 1198 | 1351 | 4225 | 3568 | 1329 | 1104 | 6658 | 6777 |
| AgrioBioTech XR96-1 | 1663 | 1191 | 1343 | 4197 | . | 1626 | 1329 | 7152 | . |
| Early Grazer | 1619 | 1169 | 1358 | 4146 | 3485 | 1438 | 1311 | 6895 | 6936 |
| Hancock | 1597 | 1271 | 1278 | 4146 | . | 1496 | 1706 | 7348 | . |
| Wrens Abruzzi | 1648 | 1148 | 1351 | 4146 | 3558 | 1213 | 1139 | 6497 | 6563 |
| FL99RP11 | 1604 | 1125 | 1394 | 4124 | . | 1307 | 1067 | 6498 | . |
| GA96RS6 | 1800 | 1023 | 1300 | 4123 | . | 1554 | 1510 | 7187 | . |
| Oklon | 1517 | 1198 | 1387 | 4102 | 3551 | 1710 | 1532 | 7344 | 7430 |
| FL98RP12 | 1626 | 1085 | 1380 | 4091 | 3527 | 1285 | 1220 | 6596 | 6714 |
| Wintergrazer 70 | 1467 | 1198 | 1416 | 4081 | 3442 | 1532 | 1409 | 7021 | 7217 |
| AgrioBioTech XR95-3 | 1426 | 1235 | 1394 | 4055 | . | 1532 | 1351 | 6937 | . |
| FL98RP2 | 1844 | 951 | 1256 | 4051 | 3500 | 1380 | 1256 | 6687 | 6701 |
| GI-87 | 1561 | 1140 | 1343 | 4044 | 3358 | 1691 | 1459 | 7195 | 7286 |
| Wrens 96 | 1496 | 1118 | 1416 | 4030 | 3496 | 1365 | 1162 | 6556 | 6734 |
| FL98RP5.6 | 1554 | 1111 | 1343 | 4008 | 3398 | 1343 | 1242 | 6592 | 6563 |
| Elbon | 1488 | 1191 | 1314 | 3993 | 3300 | 1823 | 1525 | 7340 | 7246 |
| Kelly Grazer II | 1336 | 1271 | 1336 | 3943 | 3387 | 1771 | 1619 | 7333 | 7482 |
| FL98RP3 | 1699 | 1002 | 1227 | 3927 | 3329 | 1336 | 1351 | 6614 | 6657 |
| GA96P16M | 1532 | 1053 | 1249 | 3833 | . | 1256 | 1271 | 6360 | . |
| Maton | 1394 | 1133 | 1271 | 3797 | 3253 | 1771 | 1575 | 7144 | 7584 |
| FL98RP14L-E | 1546 | 1067 | 1147 | 3760 | 3350 | 1162 | 1198 | 6120 | 6150 |
| AgrioBioTech XR9916 | 1372 | 1089 | 1227 | 3689 | . | 1546 | 1575 | 6810 | . |
| AgrioBioTech XB97-1 | 1307 | 1140 | 1205 | 3652 | . | 1706 | 1648 | 7006 | . |
| FL98RP14-15 | 1329 | 1060 | 1155 | 3543 | 3307 | 1162 | 1191 | 5896 | 6052 |
| Amilo | 1271 | 1060 | 1145 | 3475 | . | 1517 | 1699 | 6691 | . |
| AgrioBioTech XB9912 | 1235 | 922 | 1016 | 3172 | . | 1750 | 1851 | 6773 | . |
| Average | 1570 | 1143 | 1322 | 40351 | 3466 | 1489 | 1377 | 69022 | 6945 |
| LSD at 10% Level | 249 | 90 | 67 | 304 | N.S.3 | 78 | 186 | 361 | 266 |
| Std. Err. of Entry Mean | 106 | 38 | 29 | 130 | 95 | 33 | 79 | 154 | 115 |
| 1 C.V. = 6.4%, and df for EMS = 105. 2 C.V. = 4.5%, and df for EMS = 105. 3 The F-test indicated no statistical difference at the alpha = 0.1 probability level; therefore an LSD value was not calculated. Bolding indicates entries yielding equal to highest yielding entry within a column based on Fisher’s protected LSD (P = 0.10). |
|||||||||
| Planted: | October 26, 1999. | ||||||||
| Seeding Rate: | 36 seed/foot in 7″ rows. | ||||||||
| Soil Type: | Tifton loamy sand. | ||||||||
| Soil Test: | P = High, K = Medium, and pH = 5.8. | ||||||||
| Fertilization: | 93 lb N, 50 lb P2O5, and 75 lb K2O/acre. 40 lb N/acre after 1st, 2nd, 3rd, and 4th harvests. |
||||||||
| Management: | Moldboard plowed and rototilled. | ||||||||
| Previous Crop: | Summer annual forage. | ||||||||
| Test conducted by A. E. Coy and M. D. Pippin. Last Updated on 8/14/00 | |||||||||
| Rye Forage Performance, 1999-2000 Plains, Georgia |
||||||||
| Brand-Variety | Dry Matter Yield | |||||||
| Harvest Date | ||||||||
| 1-18-00 | 2-25-00 | 3-24-00 | Total First 3 Harv. | 2-Yr Avg First 3 Harv. | 5-04-00 | Season Totals | ||
| 2000 | 2-Yr Avg | |||||||
| ——————————- lb/acre ——————————- | ||||||||
| Bates | 2004 | 1379 | 2530 | 5914 | 4093 | 864 | 6778 | 6053 |
| Pennington SPIRye | 1525 | 1401 | 2752 | 5678 | . | 625 | 6302 | . |
| AgrioBioTech XR96-1 | 1745 | 1256 | 2646 | 5647 | . | 959 | 6606 | . |
| Maton | 1401 | 1038 | 3139 | 5579 | 3650 | 879 | 6457 | 6216 |
| GI-87 | 1503 | 1075 | 2995 | 5572 | 3766 | 646 | 6218 | 6008 |
| Elbon | 1416 | 951 | 3204 | 5571 | 3631 | 668 | 6239 | 5646 |
| Wintermore | 1663 | 1351 | 2556 | 5569 | 3888 | 799 | 6368 | 5957 |
| AgrioBioTech XR9909 | 1808 | 1358 | 2371 | 5536 | . | 951 | 6487 | . |
| FL98RP2 | 2084 | 1140 | 2276 | 5499 | 3969 | 835 | 6334 | 5657 |
| Wintergrazer 70 | 1786 | 1336 | 2377 | 5499 | 3813 | 878 | 6377 | 5934 |
| AgrioBioTech XR9903 | 1793 | 1329 | 2341 | 5463 | . | 813 | 6276 | . |
| AgrioBioTech XB97-1 | 1387 | 1111 | 2957 | 5454 | . | 1094 | 6549 | . |
| AgrioBioTech XR9902 | 1445 | 1213 | 2734 | 5391 | . | 719 | 6110 | . |
| Oklon | 1626 | 1097 | 2655 | 5377 | 3778 | 770 | 6147 | 5683 |
| AgrioBioTech XR9907 | 1641 | 1351 | 2333 | 5324 | . | 748 | 6072 | . |
| FL98RP12 | 1931 | 1329 | 1967 | 5227 | 3793 | 1024 | 6250 | 5708 |
| AgrioBioTech XR95-3 | 1627 | 1227 | 2336 | 5190 | . | 871 | 6061 | . |
| Wrens 96 | 1496 | 1430 | 2129 | 5055 | 3773 | 886 | 5941 | 5584 |
| FL99RP11 | 1808 | 1365 | 1782 | 4954 | . | 835 | 5789 | . |
| AgrioBioTech XR9916 | 1176 | 1191 | 2559 | 4926 | . | 1140 | 6065 | . |
| Early Grazer | 1713 | 1343 | 1860 | 4916 | 3500 | 741 | 5657 | 5297 |
| FL98RP21 | 1634 | 1452 | 1826 | 4911 | 3599 | 1024 | 5935 | 5603 |
| FL98RP13 | 1438 | 1488 | 1961 | 4887 | 3572 | 893 | 5780 | 5387 |
| Wrens Abruzzi | 1772 | 1307 | 1752 | 4831 | 3646 | 900 | 5731 | 5415 |
| GA96P16M | 1837 | 980 | 1921 | 4738 | . | 1060 | 5798 | . |
| FL98RP10 | 1568 | 1278 | 1861 | 4707 | 3548 | 791 | 5498 | 5383 |
| Wheeler | 1779 | 951 | 1966 | 4695 | 3448 | 2229 | 6924 | 6072 |
| FL98RP3 | 1779 | 994 | 1917 | 4690 | 3507 | 929 | 5619 | 5245 |
| FL98RP5.6 | 1662 | 1241 | 1710 | 4614 | 3458 | 980 | 5594 | 5279 |
| FL98RP14L-E | 1641 | 958 | 1816 | 4415 | 3343 | 610 | 5025 | 4686 |
| FL98RP14-15 | 1510 | 915 | 1984 | 4409 | 3384 | 719 | 5128 | 4800 |
| GA96RS6 | 1772 | 733 | 1618 | 4123 | . | 1198 | 5320 | . |
| AgrioBioTech XB9912 | 530 | 777 | 2042 | 3349 | . | 2149 | 5498 | . |
| Average | 1621 | 1192 | 2269 | 50821 | 3658 | 946 | 60282 | 5581 |
| LSD at 10% Level | 247 | 193 | 270 | 464 | N.S.3 | 239 | 555 | 305 |
| Std. Err. of Entry Mean | 105 | 82 | 115 | 198 | 103 | 102 | 236 | 130 |
| 1 C.V. = 7.9%, and df for EMS = 96. 2 C.V. = 7.8%, and df for EMS = 96. 3 The F-test indicated no statistical difference at the alpha = 0.1 probability level; therefore an LSD value was not calculated. Bolding indicates entries yielding equal to highest yielding entry within a column based on Fisher’s protected LSD (P = 0.10). |
||||||||
| Planted: | October 27, 1999. | |||||||
| Seeding Rate: | 36 seed/foot in 7″ rows. | |||||||
| Soil Type: | Greenville sandy clay loam. | |||||||
| Soil Test: | P = Medium, K = High, and pH = 5.6. | |||||||
| Fertilization: | 62 lb N, 72 lb P2O5, and 36 lb K2O/acre. 50 lb N/acre after 1st, 2nd, and 3rd harvests. |
|||||||
| Management: | Subsoiled and rototilled. | |||||||
| Previous Crop: | Small grain – Grain. | |||||||
| Test conducted by A. E. Coy, M. D. Pippin, and R. R. Pines. Last Updated on 8/14/00 | ||||||||
| Rye Forage Performance, 1999-2000 Griffin, Georgia |
||||||||
| Brand-Variety | Dry Matter Yield | |||||||
| Harvest Date | ||||||||
| 12-15-99 | 2-15-00 | 3-08-00 | Total First 3 Harv. | 2-Yr Avg First 3 Harv. | 4-07-00 | Season Totals | ||
| 2000 | 2-Yr Avg | |||||||
| ——————————- lb/acre ——————————- | ||||||||
| AgrioBioTech XR9907 | 1931 | 2774 | 1899 | 6603 | . | 2341 | 8945 | . |
| Wintergrazer 70 | 2048 | 2648 | 1623 | 6320 | 6534 | 2486 | 8805 | 8276 |
| Bates | 1724 | 2648 | 1943 | 6314 | 6365 | 2266 | 8580 | 7946 |
| Wrens Abruzzi | 1689 | 2432 | 2019 | 6140 | 5840 | 1893 | 8033 | 7415 |
| Early Grazer | 1848 | 2161 | 2112 | 6121 | 5724 | 2015 | 8136 | 7152 |
| AgrioBioTech XR9909 | 1721 | 2349 | 2039 | 6109 | . | 1894 | 8003 | . |
| AgrioBioTech XR9902 | 1512 | 2137 | 2257 | 5906 | . | 2380 | 8286 | . |
| Hancock | 2105 | 1857 | 1750 | 5712 | . | 3118 | 8830 | . |
| Wrens 96 | 1725 | 2404 | 1531 | 5660 | 5891 | 1846 | 7506 | 7401 |
| GA96P16M | 2375 | 1670 | 1574 | 5619 | . | 1768 | 7387 | . |
| Pennington SPIRye | 1426 | 2047 | 2127 | 5599 | . | 2289 | 7888 | . |
| GI-87 | 1726 | 1500 | 2277 | 5503 | 5217 | 3035 | 8537 | 7393 |
| Oklon | 1585 | 1753 | 2119 | 5457 | 5484 | 2530 | 7987 | 7254 |
| Elbon | 1811 | 1470 | 2144 | 5425 | 5802 | 3052 | 8476 | 7890 |
| AgrioBioTech XR9903 | 1462 | 2005 | 1943 | 5410 | . | 2088 | 7498 | . |
| AgrioBioTech XR95-3 | 1630 | 1701 | 2015 | 5345 | . | 2363 | 7708 | . |
| Maton | 1580 | 1472 | 2208 | 5260 | 5052 | 3097 | 8356 | 7440 |
| Wheeler | 2128 | 1519 | 1470 | 5116 | 4919 | 3036 | 8152 | 7784 |
| AgrioBioTech XB97-1 | 1241 | 1627 | 2077 | 4945 | . | 2840 | 7785 | . |
| Wintermore | 1529 | 1346 | 1911 | 4786 | 4931 | 2335 | 7120 | 6677 |
| AgrioBioTech XR96-1 | 1712 | 1223 | 1709 | 4644 | . | 2270 | 6914 | . |
| AgrioBioTech XR9916 | 1151 | 1424 | 2043 | 4618 | . | 2421 | 7039 | . |
| AgrioBioTech XB9912 | 928 | 1545 | 1994 | 4467 | . | 2408 | 6875 | . |
| Average | 1678 | 1900 | 1947 | 55251 | 5614 | 2425 | 79502 | 7512 |
| LSD at 10% Level | 521 | 555 | N.S.3 | 923 | 570 | 317 | 952 | N.S. |
| Std. Err. of Entry Mean | 221 | 235 | 206 | 391 | 241 | 134 | 404 | 247 |
| 1 C.V. = 14.2%, and df for EMS = 66. 2 C.V. = 10.1%, and df for EMS = 66. 3 The F-test indicated no statistical difference at the alpha = 0.1 probability level; therefore an LSD value was not calculated. Bolding indicates entries yielding equal to highest yielding entry within a column based on Fisher’s protected LSD (P = 0.10). |
||||||||
| Planted: | October 4, 1999. | |||||||
| Seeding Rate: | 36 seed/foot in 7″ rows. | |||||||
| Soil Type: | Cecil sandy clay loam. | |||||||
| Soil Test: | P = High, K = High, and pH = 6.3. | |||||||
| Fertilization: | 49 lb N, 98 lb P2O5, and 147 lb K2O/acre. 50 lb N/acre after 1st, 2nd, and 3rd harvests. |
|||||||
| Management: | Moldboard plowed and rototilled. | |||||||
| Previous Crop: | Canola. | |||||||
| Test conducted by P. A. Rose. Last Updated on 8/14/00 | ||||||||
| Rye Forage Performance, 1999-2000 Quincy, Florida |
|||||||
| Brand-Variety | Dry Matter Yield | ||||||
| Harvest Date | |||||||
| 12-08-99 | 1-11-00 | 2-20-00 | Total First 3 Harv. | 3-21-00 | 5-08-00 | Season Total 2000 | |
| ——————————- lb/acre ——————————- | |||||||
| Wintermore | 1538 | 1780 | 2517 | 5835 | 4910 | 335 | 11079 |
| Oklon | 1599 | 1712 | 2468 | 5779 | 5051 | 462 | 11292 |
| Wintergrazer 70 | 1390 | 1813 | 2520 | 5723 | 2993 | 623 | 9339 |
| Maton | 1253 | 1780 | 2603 | 5636 | 5493 | 439 | 11568 |
| AgrioBioTech XR9916 | 1354 | 1856 | 2386 | 5597 | 5035 | 439 | 11070 |
| Early Grazer | 1229 | 2068 | 2274 | 5570 | 4259 | 381 | 10210 |
| FL98RP21 | 1272 | 1867 | 2425 | 5565 | 3519 | 676 | 9759 |
| AgrioBioTech XR95-3 | 1477 | 1871 | 2208 | 5556 | 4735 | 300 | 10590 |
| Bates | 1325 | 1916 | 2310 | 5551 | 4432 | 416 | 10398 |
| FL98RP5.6 | 1563 | 1786 | 2133 | 5482 | 3446 | 277 | 9205 |
| FL98RP12 | 1639 | 1674 | 2152 | 5465 | 3263 | 173 | 8900 |
| Hancock | 1269 | 1724 | 2450 | 5443 | 3463 | 1166 | 10071 |
| Pennington SPIRye | 1361 | 1562 | 2499 | 5422 | 4545 | 392 | 10359 |
| AgrioBioTech XR9909 | 1564 | 1567 | 2271 | 5402 | 4391 | 346 | 10139 |
| Wrens Abruzzi | 1420 | 2011 | 1962 | 5393 | 2626 | 168 | 8187 |
| AgrioBioTech XR9903 | 1372 | 1867 | 2152 | 5390 | 4627 | 519 | 10536 |
| FL98RP10 | 1422 | 1981 | 1881 | 5283 | 3295 | 127 | 8705 |
| AgrioBioTech XR9907 | 1655 | 1724 | 1900 | 5279 | 4480 | 288 | 10047 |
| AgrioBioTech XR9902 | 1465 | 1683 | 2108 | 5255 | 4474 | 497 | 10226 |
| FL98RP13 | 1188 | 1737 | 2263 | 5188 | 3051 | 404 | 8643 |
| FL98RP3 | 1304 | 1740 | 2091 | 5134 | 3661 | 433 | 9228 |
| Elbon | 1345 | 1713 | 2066 | 5124 | 5342 | 323 | 10788 |
| Kelly Grazer II | 1111 | 1707 | 2290 | 5108 | 4890 | 623 | 10621 |
| Amilo | 1108 | 1644 | 2313 | 5065 | 3305 | 1939 | 10309 |
| AgrioBioTech XR96-1 | 1375 | 1697 | 1978 | 5050 | 4734 | 289 | 10073 |
| GA96P16M | 1416 | 1738 | 1893 | 5046 | 3818 | 311 | 9176 |
| FL98RP14-15 | 1412 | 1708 | 1863 | 4983 | 2338 | 219 | 7540 |
| GI-87 | 1215 | 1838 | 1920 | 4973 | 5026 | 335 | 10333 |
| Wheeler | 1570 | 1517 | 1878 | 4966 | 3240 | 1675 | 9881 |
| FL99RP11 | 1262 | 1585 | 2093 | 4939 | 2700 | 632 | 8271 |
| FL98RP14L-E | 1382 | 1853 | 1681 | 4916 | 3599 | 370 | 8884 |
| Wrens 96 | 1242 | 1555 | 2108 | 4905 | 3506 | 150 | 8561 |
| AgrioBioTech XB97-1 | 1071 | 1767 | 2031 | 4869 | 5164 | 623 | 10656 |
| FL98RP2 | 1466 | 1697 | 1606 | 4770 | 4430 | 381 | 9581 |
| AgrioBioTech XB9912 | 1165 | 1383 | 2027 | 4575 | 5501 | 646 | 10722 |
| Average | 1366 | 1746 | 2152 | 52641 | 4095 | 496 | 98552 |
| LSD at 10% Level | 254 | N.S.3 | 381 | 506 | 667 | 334 | 923 |
| Std. Err. of Entry Mean | 108 | 146 | 162 | 216 | 284 | 142 | 393 |
| 1 C.V. = 8.2%, and df for EMS = 102. 2 C.V. = 8.0%, and df for EMS = 102. 3 The F-test indicated no statistical difference at the alpha = 0.1 probability level; therefore an LSD value was not calculated. Bolding indicates entries yielding equal to highest yielding entry within a column based on Fisher’s protected LSD (P = 0.10). |
|||||||
| Planted: | October 22, 1999. | ||||||
| Seeding Rate: | 36 seed/foot in 7″ rows. | ||||||
| Soil Type: | Dothan loamy fine sand. | ||||||
| Soil Test: | P = High, K = High, and pH = 6.3. | ||||||
| Fertilization: | 40 lb N, 0 lb P2O5, and 0 lb K2O/acre. 50 lb N/acre after 1st, 2nd, 3rd, and 4th harvests. |
||||||
| Management: | Moldboard plowed and rototilled. | ||||||
| Previous Crop: | Summer fallow. | ||||||
| Test conducted by A. R. Blount and A. W. Watson. Last Updated on 8/14/00 | |||||||
| Statewide Summary: Rye Forage Performance, 1998-2000 with Two- and Three-Year Averages |
|||||||||
| Brand-Variety | Dry Forage Yield | ||||||||
| Tifton | Plains | Griffin | Statewide | ||||||
| 2000 | 3-Year Avg. | 2000 | 3-Year Avg. | 2000 | 3-Year Avg. | 2000 | 2-Year Avg. | 3-Year Avg. | |
| ——————————- lb/acre ——————————- | |||||||||
| AgrioBioTech XB97-1 | 7006 | . | 6549 | . | 7785 | . | 7113 | . | . |
| AgrioBioTech XB9912 | 6773 | . | 5498 | . | 6875 | . | 6382 | . | . |
| AgrioBioTech XR95-3 | 6937 | . | 6061 | . | 7708 | . | 6902 | . | . |
| AgrioBioTech XR96-1 | 7152 | . | 6606 | . | 6914 | . | 6890 | . | . |
| AgrioBioTech XR9902 | 7376 | . | 6110 | . | 8286 | . | 7257 | . | . |
| AgrioBioTech XR9903 | 7217 | . | 6276 | . | 7498 | . | 6997 | . | . |
| AgrioBioTech XR9907 | 6956 | . | 6072 | . | 8945 | . | 7324 | . | . |
| AgrioBioTech XR9909 | 7014 | . | 6487 | . | 8003 | . | 7168 | . | . |
| AgrioBioTech XR9916 | 6810 | . | 6065 | . | 7039 | . | 6638 | . | . |
| Amilo | 6691 | . | . | . | . | . | . | . | . |
| Bates | 7094 | 6724 | 6778 | 5533 | 8580 | 7630 | 7484 | 7054 | 6629 |
| Early Grazer | 6895 | . | 5657 | . | 8136 | . | 6896 | 6462 | . |
| Elbon | 7340 | 6768 | 6239 | 5391 | 8476 | 7365 | 7352 | 6927 | 6508 |
| FL98RP10 | 6658 | . | 5498 | . | . | . | . | . | . |
| FL98RP12 | 6596 | . | 6250 | . | . | . | . | . | . |
| FL98RP13 | 6919 | . | 5780 | . | . | . | . | . | . |
| FL98RP14-15 | 5896 | . | 5128 | . | . | . | . | . | . |
| FL98RP14L-E | 6120 | . | 5025 | . | . | . | . | . | . |
| FL98RP2 | 6687 | . | 6334 | . | . | . | . | . | . |
| FL98RP21 | 6927 | . | 5935 | . | . | . | . | . | . |
| FL98RP3 | 6614 | . | 5619 | . | . | . | . | . | . |
| FL98RP5.6 | 6592 | . | 5594 | . | . | . | . | . | . |
| FL99RP11 | 6498 | . | 5789 | . | . | . | . | . | . |
| GA96P16M | 6360 | . | 5798 | . | 7387 | . | 6515 | . | . |
| GI-87 | 7195 | 6812 | 6218 | 5667 | 8537 | 6946 | 7317 | 6895 | 6475 |
| Hancock | 7348 | . | . | . | 8830 | . | . | . | . |
| JJ | 7187 | . | 5320 | . | . | . | . | . | . |
| Kelly Grazer II | 7333 | 6920 | . | . | . | . | . | . | . |
| Maton | 7144 | 7083 | 6457 | 5820 | 8356 | 7171 | 7319 | 7080 | 6691 |
| Oklon | 7344 | 6969 | 6147 | 5415 | 7987 | 6906 | 7159 | 6789 | 6430 |
| Pennington SPIRye | 7220 | . | 6302 | . | 7888 | . | 7137 | . | . |
| Wheeler | 7080 | . | 6924 | . | 8152 | . | 7385 | 6950 | . |
| Wintergrazer 70 | 7021 | 6769 | 6377 | 5613 | 8805 | 7395 | 7401 | 7142 | 6592 |
| Wintermore | 7405 | 6847 | 6368 | 5672 | 7120 | 6439 | 6964 | 6677 | 6320 |
| Wrens 96 | 6556 | 6458 | 5941 | 5207 | 7506 | 7270 | 6668 | 6573 | 6312 |
| Wrens Abruzzi | 6497 | 6221 | 5731 | 5000 | 8033 | 7317 | 6754 | 6464 | 6179 |
| Average | 6902 | 6757 | 6028 | 5480 | 7950 | 7160 | 7046 | 6819 | 6460 |
| LSD at 10% Level | 361 | 303 | 555 | 266 | 952 | N.S.1 | 446 | 280 | 227 |
| Std. Err. of Entry Mean | 154 | 108 | 236 | 94 | 404 | 200 | 307 | 174 | 141 |
| 1 The F-test indicated no statistical difference at the alpha = 0.1 probability level; therefore an LSD value was not calculated.
Bolding indicates entries yielding equal to highest yielding entry within a column based on Fisher’s protected LSD (P = 0.10). Last Updated on 8/14/00 |
|||||||||
Ryegrass
| Ryegrass Forage Performance, 1999-2000 Tifton, Georgia |
||||||||
| Brand-Variety | Dry Matter Yield | |||||||
| Harvest Date | Season Totals | |||||||
| 1-03-00 | 2-04-00 | 2-22-00 | 3-10-00 | 3-29-00 | 4-21-00 | 2000 | 2-Yr Avg | |
| ——————————- lb/acre ——————————- | ||||||||
| Marshall | 1024 | 1496 | 1278 | 1844 | 1975 | 1750 | 9366 | 9596 |
| Jumbo | 1205 | 1503 | 1264 | 1706 | 1909 | 1626 | 9213 | 9660 |
| Rio | 1162 | 1496 | 1314 | 1786 | 1808 | 1612 | 9177 | 9196 |
| Stampede | 1060 | 1452 | 1343 | 1641 | 1946 | 1634 | 9075 | 9087 |
| ME94 | 1053 | 1488 | 1409 | 1583 | 1932 | 1561 | 9025 | 9039 |
| Passerel | 907 | 1416 | 1154 | 1721 | 2048 | 1764 | 9010 | 9063 |
| Ampac Fantastic | 1104 | 1358 | 1416 | 1663 | 1720 | 1750 | 9010 | . |
| Lewis King | 1075 | 1401 | 1329 | 1619 | 1815 | 1713 | 8952 | . |
| Abundant | 1249 | 1380 | 1351 | 1663 | 1830 | 1438 | 8909 | . |
| East Texas Exp. FLX-1995 | 1053 | 1409 | 1284 | 1648 | 1866 | 1474 | 8732 | . |
| Passerel Plus | 1002 | 1321 | 1133 | 1626 | 2084 | 1554 | 8719 | 9039 |
| FL X1998(SII)LR | 835 | 1271 | 1206 | 1684 | 2127 | 1583 | 8705 | 9074 |
| Lafayette | 1023 | 1423 | 1126 | 1583 | 2084 | 1459 | 8697 | 8417 |
| Jackson | 951 | 1300 | 1300 | 1830 | 1735 | 1575 | 8690 | 9250 |
| Big Daddy | 1038 | 1387 | 1271 | 1539 | 1822 | 1619 | 8676 | 9047 |
| Common | 1184 | 1539 | 1322 | 1546 | 1742 | 1307 | 8639 | 8346 |
| Florina | 1082 | 1409 | 1278 | 1561 | 1786 | 1452 | 8567 | . |
| TXR2000-T2 | 678 | 1140 | 1329 | 1742 | 1859 | 1699 | 8446 | . |
| TAM 90 | 980 | 1459 | 1300 | 1510 | 1764 | 1394 | 8407 | 8297 |
| FLX1999(GA)LR | 966 | 1322 | 1256 | 1662 | 1750 | 1445 | 8400 | . |
| TXR2000-1 | 828 | 1300 | 1227 | 1706 | 1953 | 1351 | 8364 | . |
| Natchez | 893 | 1227 | 1206 | 1575 | 1772 | 1365 | 8038 | . |
| Average | 1016 | 1386 | 1277 | 1656 | 1878 | 1551 | 87641 | 9008 |
| LSD at 10% Level | 141 | 151 | 115 | N.S.2 | 214 | 215 | 499 | 388 |
| Std. Err. of Entry Mean | 60 | 64 | 48 | 87 | 91 | 91 | 212 | 164 |
| 1 C.V. = 4.8%, and df for EMS = 63. 2 The F-test indicated no statistical difference at the alpha = 0.1 probability level; therefore an LSD value was not calculated. Bolding indicates entries yielding equal to highest yielding entry within a column based on Fisher’s protected LSD (P = 0.10). |
||||||||
| Planted: | October 26, 1999. | |||||||
| Seeding Rate: | 50 lb/acre in 7″ rows. | |||||||
| Soil Type: | Tifton loamy sand. | |||||||
| Soil Test: | P = High, K = Medium, and pH = 5.8. | |||||||
| Fertilization: | 93 lb N, 50 lb P2O5, and 75 lb K2O/acre. 40 lb N/acre after 1st, 2nd, 3rd, 4th, and 5th harvests. |
|||||||
| Management: | Moldboard plowed and rototilled. | |||||||
| Previous Crop: | Summer annual forage. | |||||||
| Test conducted by A. E. Coy and M. D. Pippin. Last Updated on 8/14/00 | ||||||||
| Ryegrass Forage Performance, 1999-2000 Plains, Georgia |
|||||||
| Brand-Variety | Dry Matter Yield | ||||||
| Harvest Date | Season Totals | ||||||
| 1-21-00 | 2-25-00 | 3-22-00 | 4-21-00 | 5-04-00 | 2000 | 2-Yr Avg | |
| ——————————- lb/acre ——————————- | |||||||
| Jumbo | 421 | 1133 | 3058 | 1213 | 1343 | 7168 | 7871 |
| Marshall | 362 | 784 | 3200 | 1372 | 1430 | 7148 | 7879 |
| East Texas Exp. FLX-1995 | 443 | 1206 | 3158 | 1162 | 1176 | 7145 | . |
| Big Daddy | 487 | 1111 | 2913 | 1176 | 1321 | 7008 | 7631 |
| Ampac Fantastic | 392 | 1307 | 2930 | 1082 | 1155 | 6865 | . |
| Abundant | 400 | 1111 | 2993 | 1031 | 1256 | 6790 | . |
| Common | 610 | 1082 | 2856 | 929 | 1256 | 6733 | 7450 |
| Lafayette | 276 | 871 | 3241 | 1053 | 1285 | 6726 | 7619 |
| Passerel Plus | 505 | 843 | 2877 | 1184 | 1184 | 6593 | 7776 |
| ME94 | 305 | 857 | 3119 | 1133 | 1126 | 6539 | 7342 |
| TAM 90 | 363 | 1017 | 3059 | 951 | 1140 | 6529 | 7479 |
| FLX1999(GA)LR | 392 | 1031 | 2807 | 1009 | 1278 | 6516 | . |
| Natchez | 247 | 929 | 2876 | 1242 | 1205 | 6498 | . |
| Lewis King | 319 | 1038 | 2889 | 1031 | 1169 | 6446 | . |
| Passerel | 283 | 668 | 2882 | 1336 | 1220 | 6389 | 7521 |
| TXR2000-1 | 116 | 690 | 3322 | 915 | 1336 | 6379 | . |
| Stampede | 268 | 907 | 2985 | 980 | 1213 | 6353 | 7571 |
| Rio | 240 | 784 | 2948 | 1096 | 1278 | 6346 | 7445 |
| Florina | 225 | 835 | 3006 | 1009 | 1256 | 6331 | . |
| TXR2000-T2 | 94 | 719 | 2898 | 1045 | 1256 | 6013 | . |
| Jackson | 327 | 915 | 2805 | 893 | 1046 | 5984 | 7116 |
| FL X1998(SII)LR | 138 | 690 | 2933 | 958 | 1249 | 5968 | 7173 |
| Average | 328 | 933 | 2989 | 1082 | 1235 | 65671 | 7529 |
| LSD at 10% Level | 182 | 183 | 245 | 132 | 141 | 498 | N.S.2 |
| Std. Err. of Entry Mean | 77 | 78 | 104 | 56 | 60 | 211 | 146 |
| 1 C.V. = 6.4%, and df for EMS = 63. 2 The F-test indicated no statistical difference at the alpha = 0.1 probability level; therefore an LSD value was not calculated. Bolding indicates entries yielding equal to highest yielding entry within a column based on Fisher’s protected LSD (P = 0.10). |
|||||||
| Planted: | October 27, 1999. | ||||||
| Seeding Rate: | 50 lb/acre in 7″ rows. | ||||||
| Soil Type: | Greenville sandy clay loam. | ||||||
| Soil Test: | P = Medium, K = High, and pH = 5.6. | ||||||
| Fertilization: | 62 lb N, 72 lb P2O5, and 36 lb K2O/acre. 50 lb N/acre after 1st, 2nd, 3rd, and 4th harvests. |
||||||
| Management: | Subsoiled and rototilled. | ||||||
| Previous Crop: | Small grain – Grain. | ||||||
| Test conducted by A. E. Coy, M. D. Pippin, and R. R. Pines. Last Updated on 8/14/00 | |||||||
| Ryegrass Forage Performance, 1999-2000 Griffin, Georgia |
|||||||
| Brand-Variety | Dry Matter Yield | ||||||
| Harvest Date | Season Totals | ||||||
| 1-07-00 | 2-21-00 | 3-09-00 | 4-07-00 | 5-08-00 | 2000 | 2-Yr Avg | |
| ——————————- lb/acre ——————————- | |||||||
| Marshall | 1506 | 1246 | 1841 | 3679 | 2289 | 10561 | 10524 |
| Passerel Plus | 1420 | 992 | 1710 | 3674 | 2271 | 10067 | 9544 |
| Lewis King | 1311 | 1446 | 1844 | 3048 | 2248 | 9896 | . |
| TAM 90 | 1492 | 1417 | 1828 | 3103 | 1971 | 9810 | 9671 |
| ME94 | 1480 | 1058 | 1731 | 3522 | 1880 | 9671 | 9421 |
| East Texas Exp. FLX-1995 | 1363 | 1518 | 1858 | 2776 | 2093 | 9608 | . |
| Lafayette | 1327 | 1421 | 1775 | 3005 | 2065 | 9593 | 9458 |
| Florina | 838 | 1163 | 1810 | 3433 | 2292 | 9536 | . |
| Stampede | 1000 | 1061 | 1886 | 3437 | 2141 | 9524 | 9609 |
| Common | 2093 | 1503 | 1531 | 2805 | 1544 | 9476 | 9912 |
| Jumbo | 1520 | 1304 | 1659 | 2895 | 2076 | 9454 | 9723 |
| FLX1999(GA)LR | 1616 | 1338 | 1746 | 2997 | 1655 | 9351 | . |
| TXR2000-1 | 927 | 1008 | 1875 | 3407 | 2111 | 9327 | . |
| Big Daddy | 1653 | 1415 | 1616 | 2892 | 1742 | 9318 | 9319 |
| Ampac Fantastic | 1151 | 1404 | 2025 | 2736 | 1994 | 9310 | . |
| Natchez | 1345 | 1362 | 1560 | 3030 | 1954 | 9251 | . |
| Jackson | 1100 | 1009 | 1802 | 3465 | 1782 | 9158 | 9308 |
| Rio | 1118 | 1225 | 1768 | 2955 | 2033 | 9098 | 8947 |
| Passerel | 892 | 824 | 1719 | 3542 | 2084 | 9060 | 9168 |
| Abundant | 1708 | 1228 | 1522 | 2808 | 1604 | 8869 | . |
| TXR2000-T2 | 646 | 1100 | 1743 | 3180 | 2057 | 8725 | . |
| FL X1998(SII)LR | 562 | 782 | 1702 | 3375 | 2240 | 8660 | 9243 |
| Average | 1276 | 1219 | 1752 | 3171 | 2006 | 94241 | 9527 |
| LSD at 10% Level | 357 | 245 | N.S.2 | 390 | 258 | 713 | N.S. |
| Std. Err. of Entry Mean | 175 | 120 | 118 | 191 | 127 | 349 | 270 |
| 1 C.V. = 6.4%, and df for EMS = 63. 2 The F-test indicated no statistical difference at the alpha = 0.1 probability level; therefore an LSD value was not calculated. Bolding indicates entries yielding equal to highest yielding entry within a column based on Fisher’s protected LSD (P = 0.10). |
|||||||
| Planted: | October 4, 1999. | ||||||
| Seeding Rate: | 50 lb/acre in 7″ rows. | ||||||
| Soil Type: | Cecil sandy clay loam. | ||||||
| Soil Test: | P = High, K = High, and pH = 6.3. | ||||||
| Fertilization: | 49 lb N, 98 lb P2O5, and 147 lb K2O/acre. 50 lb N/acre after 1st, 2nd, 3rd, and 4th harvests. |
||||||
| Management: | Moldboard plowed and rototilled. | ||||||
| Previous Crop: | Canola. | ||||||
| Test conducted by P. A. Rose. Last Updated on 8/14/00 | |||||||
| Ryegrass Forage Performance, 1999-2000 Quincy, Florida |
||||||
| Brand-Variety | Dry Matter Yield | |||||
| Harvest Date | Season Total | |||||
| 12-08-99 | 1-11-00 | 2-16-00 | 3-21-00 | 5-04-00 | 2000 | |
| ——————————- lb/acre ——————————- | ||||||
| Passerel Plus | 734 | 1645 | 1608 | 6687 | 4344 | 15017 |
| Abundant | 780 | 1624 | 1289 | 6156 | 5041 | 14890 |
| Jumbo | 745 | 1822 | 1678 | 5774 | 4717 | 14734 |
| Natchez | 676 | 1582 | 1323 | 6205 | 4673 | 14458 |
| Big Daddy | 965 | 1777 | 1572 | 6290 | 3449 | 14052 |
| Lewis King | 508 | 1502 | 1824 | 6049 | 4141 | 14025 |
| Rio | 591 | 1544 | 1750 | 5621 | 4383 | 13889 |
| ME94 | 629 | 1611 | 1536 | 5733 | 4230 | 13739 |
| East Texas Exp. FLX-1995 | 584 | 1853 | 1635 | 6089 | 3466 | 13626 |
| Marshall | 543 | 1542 | 1353 | 5965 | 4055 | 13458 |
| Stampede | 454 | 1539 | 1903 | 5790 | 3662 | 13347 |
| Florina | 559 | 1568 | 1620 | 5689 | 3779 | 13214 |
| Passerel | 589 | 1503 | 1591 | 5642 | 3887 | 13212 |
| Jackson | 701 | 1721 | 1786 | 5531 | 3251 | 12990 |
| Common | 675 | 2006 | 1199 | 5264 | 3607 | 12751 |
| Ampac Fantastic | 522 | 1419 | 1358 | 5710 | 3601 | 12609 |
| TAM 90 | 604 | 1819 | 1609 | 5252 | 3320 | 12603 |
| TXR2000-T2 | 315 | 1205 | 1540 | 5980 | 3492 | 12531 |
| TXR2000-1 | 372 | 1445 | 1565 | 5265 | 3877 | 12523 |
| FLX1999(GA)LR | 767 | 1753 | 1518 | 5336 | 3042 | 12416 |
| Lafayette | 539 | 1784 | 1609 | 5031 | 3192 | 12154 |
| FL X1998(SII)LR | 332 | 1252 | 1385 | 5889 | 3254 | 12111 |
| Average | 599 | 1614 | 1557 | 5770 | 3839 | 133791 |
| LSD at 10% Level | 186 | 231 | 298 | 617 | 714 | 1067 |
| Std. Err. of Entry Mean | 79 | 98 | 126 | 262 | 302 | 452 |
| 1 C.V. = 6.8%, and df for EMS = 63.
Bolding indicates entries yielding equal to highest yielding entry within a column based on Fisher’s protected LSD (P = 0.10). |
||||||
| Planted: | October 22, 1999. | |||||
| Seeding Rate: | 50 lb/acre in 7″ rows. | |||||
| Soil Type: | Dothan loamy fine sand. | |||||
| Soil Test: | P = High, K = High, and pH = 6.3. | |||||
| Fertilization: | 40 lb N, 0 lb P2O5, and 0 lb K2O/acre. 50 lb N/acre after 1st, 2nd, 3rd, and 4th harvests. |
|||||
| Management: | Moldboard plowed and rototilled. | |||||
| Previous Crop: | Summer fallow. | |||||
| Test conducted by A. R. Blount and A. W. Watson. Last Updated on 8/14/00 | ||||||
| Statewide Summary: Ryegrass Forage Performance, 1998-2000 with Two- and Three-Year Averages |
|||||||||
| Brand-Variety | Dry Forage Yield | ||||||||
| Tifton | Plains | Griffin | Statewide | ||||||
| 2000 | 3-Year Avg. | 2000 | 3-Year Avg. | 2000 | 3-Year Avg. | 2000 | 2-Year Avg. | 3-Year Avg. | |
| ——————————- lb/acre ——————————- | |||||||||
| Abundant | 8909 | . | 6790 | . | 8869 | . | 8189 | . | . |
| Ampac Fantastic | 9010 | . | 6865 | . | 9310 | . | 8395 | . | . |
| Big Daddy | 8676 | 8952 | 7008 | 7599 | 9318 | 9778 | 8334 | 8666 | 8777 |
| Common | 8639 | 8211 | 6733 | 7227 | 9476 | 9851 | 8283 | 8569 | 8430 |
| East Texas Exp. FLX-1995 | 8732 | . | 7145 | . | 9608 | . | 8495 | . | . |
| FL X1998(SII)LR | 8705 | . | 5968 | . | 8660 | . | 7777 | 8497 | . |
| FLX1999(GA)LR | 8400 | . | 6516 | . | 9351 | . | 8089 | . | . |
| Florina | 8567 | . | 6331 | . | 9536 | . | 8145 | . | . |
| Jackson | 8690 | 8906 | 5984 | 6945 | 9158 | 9464 | 7944 | 8558 | 8438 |
| Jumbo | 9213 | 8953 | 7168 | 7614 | 9454 | 9867 | 8612 | 9085 | 8811 |
| Lafayette | 8697 | 8217 | 6726 | 7511 | 9593 | 9707 | 8339 | 8498 | 8478 |
| Lewis King | 8952 | . | 6446 | . | 9896 | . | 8431 | . | . |
| ME94 | 9025 | 8712 | 6539 | 7136 | 9671 | 9649 | 8411 | 8601 | 8499 |
| Marshall | 9366 | 8908 | 7148 | 7590 | 10561 | 10459 | 9025 | 9333 | 8986 |
| Natchez | 8038 | . | 6498 | . | 9251 | . | 7929 | . | . |
| Stampede | 9075 | . | 6353 | . | 9524 | . | 8317 | 8756 | . |
| Passerel | 9010 | 8804 | 6389 | 7392 | 9060 | 9301 | 8153 | 8584 | 8499 |
| Passerel Plus | 8719 | . | 6593 | . | 10067 | . | 8459 | 8786 | . |
| Rio | 9177 | 8663 | 6346 | 7338 | 9098 | 9286 | 8207 | 8529 | 8429 |
| TAM 90 | 8407 | 8114 | 6529 | 7370 | 9810 | 10181 | 8249 | 8482 | 8555 |
| TXR2000-1 | 8364 | . | 6379 | . | 9327 | . | 8023 | . | . |
| TXR2000-T2 | 8446 | . | 6013 | . | 8725 | . | 7728 | . | . |
| Average | 8764 | 8644 | 6567 | 7372 | 9424 | 9754 | 8251 | 8688 | 8590 |
| LSD at 10% Level | 499 | N.S.1 | 498 | 308 | 713 | 590 | 406 | 301 | 254 |
| Std. Err. of Entry Mean | 212 | 138 | 211 | 110 | 349 | 210 | 245 | 187 | 158 |
| 1 The F-test indicated no statistical difference at the alpha = 0.1 probability level; therefore an LSD value was not calculated.
Bolding indicates entries yielding equal to highest yielding entry within a column based on Fisher’s protected LSD (P = 0.10). Last Updated on 8/14/00 |
|||||||||
Sources of Seed for the 1999-2000 Small Grains Performance Tests
| Crop | Variety – Seed Source | |
| Barley | – | Boone – North Carolina Foundation Seeds, 8220 Riley Hill Road, Zebulon, NC 27597 |
| – | Callao, Nomini, and Starling – Virginia Tech, Crop and Soil Science Dept., Blacksburg, VA 24061 | |
| – | GA-Acton, GA-Luttrell, and Wysor – Georgia Seed Development Commission, 2420 S. Milledge Ave., Athens, GA 30605 | |
| Oat | – | Arkansas Co. and Harrison – Arkansas County Seed Company, Inc., P.O. Box 43, Stuttgart, AR 72160 |
| – | Chapman – Georgia Seed Development Commission, 2420 S. Milledge Ave., Athens, GA 30605 | |
| – | FL, FLX, and Horizon 314 – University of Florida, Route 3 Box 4370, Quincy, FL 32350 | |
| – | lapar – USDA-ARS, 1420 Experiment Station Road, Watkinsville, GA 30677 | |
| – | LA – LSU Agricultural Center, Agronomy Dept., Baton Rouge, LA 70803 | |
| – | NK-Coker 227 – Plantation Seed Conditioners, RR1 Box 695, Newton, GA 31770 | |
| – | Rodgers – North Carolina Foundation Seeds, 8220 Riley Hill Rd., Zebulon, NC 27597 | |
| – | SC910337 – Clemson University, 275 Poole Agricultural Center, Clemson, SC 29634 | |
| – | SS – Southern States Coop, PO Box 26234, Richmond, VA 23260 | |
| – | Secretariat – Terral Seed, Inc., PO Box 826, Lake Providence, LA 71254 | |
| Triticale | – | Arcia – North Carolina Foundation Seeds, 8220 Riley Hill Rd., Zebulon, NC 27597 |
| – | FL, FL 201, Florico, and Sunland – University of Florida, Route 3 Box 4370, Quincy, FL 32351 | |
| – | Trical 498 – Seed Resources, Inc., PO Box 326, Tulia, TX 79088 | |
| Rye | – | AgriBio Tech – AgriBio Tech, 36030 Tennessee Rd., Albany, OR 97321 |
| – | Amilo – Ehmke Seed, 74 West Road 130, Healy, KS 67850 | |
| – | Bates, Elbon, Maton, and Oklon – The Noble Foundation, PO Box 2180, Ardmore, OK 73402 | |
| – | Early Graze and Wheeler – Southern States Coop., PO Box 26234, Richmond, VA 23260 | |
| – | FL – University of Florida, Route 3 Box 4370, Quincy, FL 32351 | |
| – | GA and UGA – University of Georgia, Crop & Soil Science Dept., Georgia Station, Griffin, GA 30223-1797 | |
| – | GI-87 – Carl R. Gurley, Inc., PO Box 995, Princeton, NC 27569 | |
| – | Hancock – Michigan Agricultural Commodities, Inc., 10895 E. US 223, Box 96, Blissfield, MI 49228 | |
| – | Kelly Grazer II – Kelly Seed Co., Inc., PO Box 370, Harford, AL 36344 | |
| – | SPIRye and Wintergrazer 70 – Pennington/Seed Production, Inc., PO Box 290, Madison, GA 30650 | |
| – | Wintermore – Seed Resources, Inc., PO Box 326, Tulia, TX 79088 | |
| – | Wrens 96 and Wrens Abruzzi – Georgia Seed Development Commission, 2420 S. Milledge Ave., Athens, GA 30605 | |
| Ryegrass | – | Abundant – Jenks Seed, PO Box 34, Shedd, OR 97377 |
| – | Big Daddy – Southern States Coop., PO Box 26234, Richmond, VA 23260 | |
| – | Exp. FLX-1995 – East Texas Seed Company, PO Box 569, Tyler, TX 75710 | |
| – | Fantastic – Ampac Seed Co., PO Box 318, Tangent, OR 97389 | |
| – | Florina – Proseeds Marketing, Inc., 13963 Westside Lane South, Jefferson, OR 97352 | |
| – | FLX – University of Florida, Gainesville, FL 32611 | |
| – | Jackson, Marshall, and ME94 – The Wax Company, Inc., PO Box 60, Amorg, MS 38821 | |
| – | King – Lewis Seed Co., 33820 Linn West Drive, Shedd, OR 97377 | |
| – | Lafayette, Natchez, Rio, and Stampede – AgriBio Tech, 36030 Tennessee Rd., Albany, OR 97321 | |
| – | Passerel and Passerel Plus – Pennington Seed, Inc., 270 Hawsand Ave, PO Box 386, Lebanon, OR 97355 | |
| – | Rustmaster – DLF Trifolium, 5757 NE Hwy. 2, Corvallis, OR 97330 | |
| – | TAM 90, TXR2000-1, and TXR2000-T2 – Texas A&M University, Drawer E, Overton, TX 75684 | |
| Wheat | – | AgriPro – AgriPro Seeds, PO Box 2365, Jonesboro, AR 72402 |
| – | AGS 2000 – AGSouth, PO Box 88838, Dunwoody, GA 30356 | |
| – | AR and Jaypee – University of Arkansas, 115 Plant Sciences Bldg., Fayetteville, AR 72701 | |
| – | BL 94-0026 and NK-Coker – Novartis Seeds, PO Box 1240, Winterville, NC 28590 | |
| – | Croplan – Land O’Lakes, Inc., PO Box 171376, Memphis, TN 38187 | |
| – | FFR, Southern States, So. States, and S St FFR – Southern States Coop., PO Box 26234, Richmond, VA 23260 | |
| – | FL – University of Florida, Route 3 Box 4370, Quincy, FL 32350 | |
| – | Fleming and Roberts – Georgia Seed Development Commission, 2420 S. Milledge Avenue, Athens, GA 30605 | |
| – | GA and UGA – University of Georgia, Crop & Soil Sciences Dept., Georgia Station, Griffin, GA 30223-1797 | |
| – | Jackson, Roane, and VA – Virginia Tech, Crop and Soil Science Dept., Blacksburg, VA 24061 | |
| – | LA – Louisiana State University Agricultural Center, Baton Rouge, LA 70803 | |
| – | Pioneer – Pioneer Hi-Bred International, Inc., 6767 Old Madison Pike #110, Huntsville, AL 35806 | |
| – | Santee – Mixon Seed Co., PO Box 1652, Orangeburg, SC 29116 | |
| – | Terral – Terral Seed, Inc., PO Box 826, Lake Providence, LA 71254 | |
| – | USG 3209 – UniSouth Genetics, Inc., 2640-C Nolensville Rd., Nashville, TN 37211 |
Editors
J. LaDon Day is program coordinator of statewide variety testing in the Department of Crop and Soil Sciences, Georgia Experiment Station, Griffin, GA 30223-1797. Anton E. Coy is a senior agricultural specialist in the Department of Crop and Soil Sciences, Coastal Plain Experiment Station, Tifton, GA 31793.