- Introduction
- 2001 Plant Disease Clinic Annual Summary
- Apple
- Blueberry
- Bunch Grape
- Canola
- Corn
- Cotton
- Muscadine Grape
- Ornamentals
- Peach
- Peanut
- Pecan
- Soybean
- Strawberry
- Tobacco
- Turf
- Vegetables
- Wheat
- Summary of Total Losses Due to Disease Damage and Cost of Control
- ATTENTION! Pesticide Precautions
It is estimated that 2001 plant disease losses, including control costs, amounted to approximately $587.107 million. The value of the crops used in this estimate was more than $4.799 billion, resulting in a 12.23 percent total disease loss across all crops included in this summary.
The estimated values for most crops used to compute these disease losses are summarized in: Georgia Agricultural Statistics Service, Georgia Farm Report Vol. 02, No. 04. Estimates for tobacco are based on Market News Service figures for growers’ net sales and do not include warehouse resales. Estimates for vegetables, strawberries, ornamentals and turf rely on specialists’ knowledge of the industry and industry sources for information.
| The Following Members of the University of Georgia Department of Plant Pathology Made Direct Contribution to this Publication: | |||
| Paul Bertrand | Tifton, GA | 912-386-7495 | bertrand@uga.edu |
| Phil Brannen | Athens, GA | 706-542-2685 | pbrannen@uga.edu |
| Barry Cunfer | Griffin, GA | 770-412-4012 | bcunfer@griffin.uga.edu |
| Jan Fowler | Athens, GA | 706-542-9146 | jfowler@uga.edu |
| Robert Kemerait | Tifton, GA | 912-386-7495 | kemerait@uga.edu |
| David Langston | Tifton, GA | 912-386-7495 | dlangsto@uga.edu |
| Alfredo Martinez | Griffin, GA | 770-228-7375 | martinez@griffin.uga.edu |
| Dan Phillips | Griffin, GA | 770-412-4009 | dphilli@griffin.uga.edu |
| Jean Williams-Woodward | Athens, GA | 706-542-9146 | jwoodwar@uga.edu |
2001 Plant Disease Clinic Annual Summary
Extension Plant Pathology maintains three clinics as educational resources for county Extension agricultural faculty to use to aid their clients in diagnosing and correcting disease- and insect-related plant problems. Plant samples are submitted directly to the county Extension faculty who, at their discretion, forward samples to the appropriate clinic. Commercial turf, fruits, forage crops, greenhouse and ornamental nursery samples are sent to the Plant Disease Clinic in Athens. Diagnoses of and control recommendations for commercial samples of field crops, pecans and vegetables are handled by the Plant Disease Clinic at the Rural Development Center in Tifton, Georgia.
All non-commercial plant samples are sent to the Homeowner IPM Clinic in Athens for disease diagnoses and/or insect diagnoses and recommendations. Diagnoses and educational recommendations are returned to the county faculty. The clinics maintain a computerized database of samples and their diagnoses, as well as a reference library for use by Extension agents, specialists, researchers, and students.
As in 2000, ornamentals (trees, herbaceous and woody landscape plants) and turf comprised most of the samples received in 2001. Total physical plant samples diagnoses increased 16 percent over volume in 2000, mostly in the areas of fruits, trees, woody ornamentals and grasses. The increase is most likely due to increased rainfall over 2000, which contributed to an increase in disease in some crops. Although county agents still use the Distance Diagnosis through Digital Imaging system for a more rapid diagnosis of some plant diseases, many agents are not utilizing the system as much as they did in 2000, or they are submitting samples through the DDDI system and then sending the physical sample to the Plant Disease Clinic for confirmation, particularly for homeowner samples.
| Clinic Summaries: 2001 Plant Specimen Diagnosis | |||
| Crop | Commercial Samples | Homeowner IPM Clinic | Total |
| Field Crops | 262 | 262 | |
| Vegetables | 369 | 135 | 504 |
| Fruits & Nuts | 135 | 78 | 213 |
| Herbaceous Ornamentals | 247 | 161 | 408 |
| Woody Ornamentals | 331 | 346 | 677 |
| Trees | 121 | 233 | 354 |
| Grasses | 626 | 484 | 1110 |
| Miscellaneous | 7 | 41 | 48 |
| TOTAL | 2098 | 1478 | 3576 |
Apple
Apples generally had high disease pressure in 2001. Fire blight was virtually nonexistent due to weather conditions during bloom. Cold damage during bloom substantially reduced apple production, and many orchards were largely abandoned relative to disease control. On remaining apples, summer rots, particularly bitter rot, were of major concern as the season progressed. For the second year in a row, a more aggressive Glomerella species was observed, and the disease resulted in severe defoliation of apple trees where it occurred. We will need to monitor for future outbreaks of this disease. Cost of control included increased pesticide usage for summer rots. Often, chemical fungicides did not adequately suppress disease.
| Disease | % Reduction in Crop Value | Damage ($ Thousands) |
Cost of Control ($ Thousands) |
Total ($ Thousands) |
| Fire Blight | 0.1 | 2.3 | 40.0 | 42.3 |
| Bitter Rot | 10.0 | 229.3 | 100.0 | 329.3 |
| Bot Rot | 1.0 | 22.9 | 52.0 | 74.9 |
| Black Rot | 0.1 | 2.3 | 33.0 | 35.3 |
| Alternaria Leaf Spot | 0.1 | 2.3 | —1 | 2.3 |
| Powdery Mildew | 0.1 | 2.3 | 11.5 | 13.8 |
| Sooty Blotch | 0.1 | 2.3 | —1 | 2.3 |
| Fly Speck | 0.1 | 2.3 | —1 | 2.3 |
| Cedar Apple Rust | 0.1 | 2.3 | —1 | 2.3 |
| Scab | 0.05 | 1.1 | —1 | 1.1 |
| Other Diseases | 0.05 | 1.1 | 1.0 | 1.1 |
| Total | 11.8 | 270.5 | 237.5 | 507.0 |
| 1Controlled with fungicides applied for other diseases. Estimated by Phil Brannen, Extension Plant Pathologist. |
||||
Blueberry
Blueberry production was down in 2001, with a total production of 17,000,000 lbs. valued at $13.5 million. Mummy berry and rot diseases were observed at very low levels, largely due to dry conditions and good fungicide programs. Botrytis blight was essentially absent as no predisposing freezes occurred during bloom. In southern highbush cultivars, problems due to foliar diseases and dieback were observed. The southern highbush cultivars have incredible market potential, but the leaf spot disease and dieback will have to be addressed.
| Disease | % Reduction in Crop Value |
Damage ($ Thousands) |
Cost of Control ($ Thousands) |
Total ($ Thousands) |
| Mummy Berry | 1.5 | 211.6 | 500.0 | 711.6 |
| Botrytis Blight | 0.1 | 14.1 | 200.0 | 214.1 |
| Foliar Disease | 1.0 | 141.0 | 20.0 | 161.1 |
| Dieback | 1.0 | 141.0 | 10.0 | 151.1 |
| Phytophthora Root Rot | 0.5 | 70.5 | 10.0 | 80.5 |
| Total | 4.1 | 578.2 | 740.0 | 1,318.4 |
| Estimate by Phil Brannen, Extension Plant Pathologist | ||||
Bunch Grape
Bunch grape production, predominantly wine grapes, continues to increase in the north Georgia area. Disease pressure was very high among bunch grape vineyards in 2001. Wet conditions resulted in very high rot pressure, and mildew pressure was also high. Pierce’s disease, caused by a bacterial pathogen, was observed at elevations of 1800-2000 feet, but disease levels did not increase. Crown gall, also caused by a bacterial pathogen, did increase as a result of cold-damaged vines. Pathological issues resulted in a substantial value loss in 2001.
| Disease | % Reduction in Crop Value |
Damage ($ Thousands) |
Cost of Control ($ Thousands) |
Total ($ Thousands) |
| Botrytis | 5.0 | 98.3 | 30.0 | 128.3 |
| Downy Mildew | 2.0 | 39.3 | 20.0 | 59.3 |
| Black Rot | 1.0 | 19.7 | 20.0 | 39.7 |
| Powdery Mildew | 5.0 | 98.3 | 5.0 | 103.3 |
| Phomopsis Cane Blight | 2.0 | 39.3 | —1 | 39.3 |
| Crown Gall | 1.0 | 19.7 | 5.0 | 24.7 |
| Pierce’s Disease | 1.0 | 19.7 | 5.0 | 24.7 |
| Total | 17.0 | 334.3 | 85.0 | 419.3 |
| 1 Controlled with fungicides applied for other diseases. Estimate by Phil Brannen, Extension Plant Pathologist |
||||
Canola
2001 Disease Loss Estimates for Canola Are Not Available. No Canola Was Planted in Georgia in 2001.
Corn
Conditions were better for corn production in Georgia in 2001 than they had been for several years. Rainfall was generally favorable for crop production across many areas of the state and led to increased yields from 2000. In 2001, corn was planted on 265,000 acres and harvested from 220,000 acres. The yield was 134 bu/A, up from 107 bu/A in 2000. The 2001 crop was valued at $63,382,000. In 2001, foliar diseases, especially southern corn leaf blight, caused by Bipolaris maydis, were common. This increase was closely linked to locally abundant rainfall that created conditions favorable for disease development. Wetter conditions during the season should have helped to reduce the level of aflatoxin, caused by Aspergillus flavus, as production of this mycotoxin is favored by hot, dry weather.
| Disease | % Reduction in Crop Value |
Damage ($ Millions) |
Cost of Control ($ Millions) |
Total ($ Millions) |
| Root & Stalk Rot | 0.1 | 0.06 | 0.0 | 0.06 |
| Nematodes | 2.0 | 1.26 | 1.0 | 2.26 |
| Mycotoxins | 7.5 | 4.75 | 0.0 | 4.75 |
| Leaf Diseases | 5.0 | 3.17 | 0.0 | 3.17 |
| Total | 14.6 | 9.24 | 1.0 | 10.24 |
| Estimate by Robert Kemerait, Extension Plant Pathologist | ||||
Cotton
Increased rainfall during the 2001 season helped boost yields in last season’s crop. Cotton was planted on 1.5 million acres in 2001 and harvested from an estimated 1.49 million acres. The average lint yield was 709 lb/A for a total production of 2.2 million bales. the crop was valued at $370,656,000. Losses to boll rot increased in 2001 from 2000 because of the locally abundant rainfall in some areas of the state. Seedling disease was also more common for the same reason. Seedling disease in Georgia is largely Rhizoctonia solani (soreshin); however, there is evidence that Pythium spp. may play a greater role in this disease complex than previously thought. Losses to nematodes, primarily southern root-knot and reniform, increased slightly in 2001, partly as a result of inadequate crop rotation in some areas.
| Disease | % Reduction in Crop Value |
Damage ($ Millions) |
Cost of Control ($ Millions) |
Total ($ Millions) |
| Boll Rot (lint) | 5.0 | 18.5 | 0.0 | 18.5 |
| Nematodes | 5.0 | 18.5 | 12.0 | 30.5 |
| Seedling Disease | 3.0 | 11.1 | 2.211 | 13.3 |
| Fusarium Wilt | 0.1 | 0.4 | 0.0 | 0.4 |
| Total | 13.1 | 48.5 | 14.2 | 62.7 |
| 1 This figure is an estimate of the cost of fungicides, both in the seed treatments and additional hopper box and in-furrow applications, that are used to manage seedling diseases. For this figure, it is estimated that approximately 15% of the cotton acreage in Georgia is treated with a fungicide in addition to the seed treatment to manage seedling disease. Estimate by Robert Kemerait, Extension Plant Pathologist |
||||
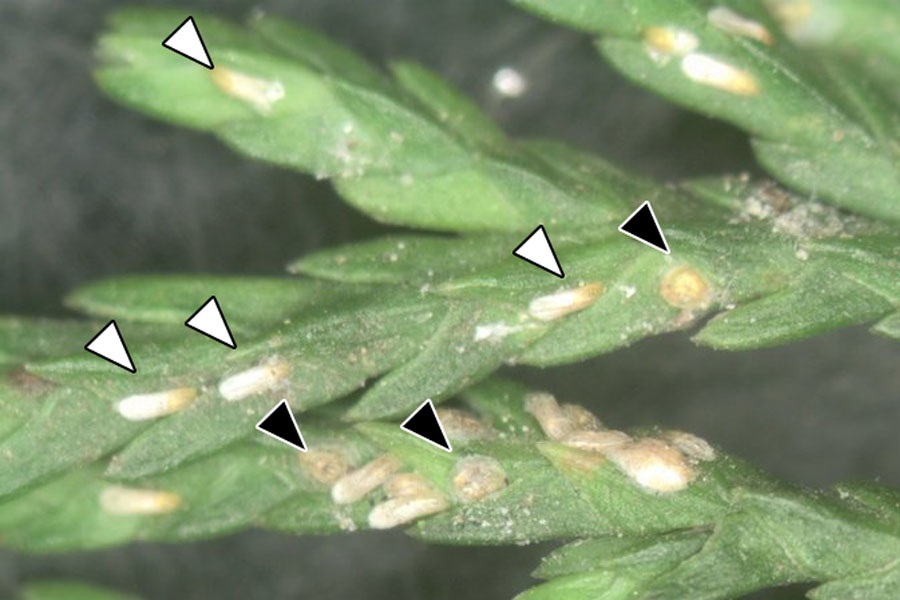
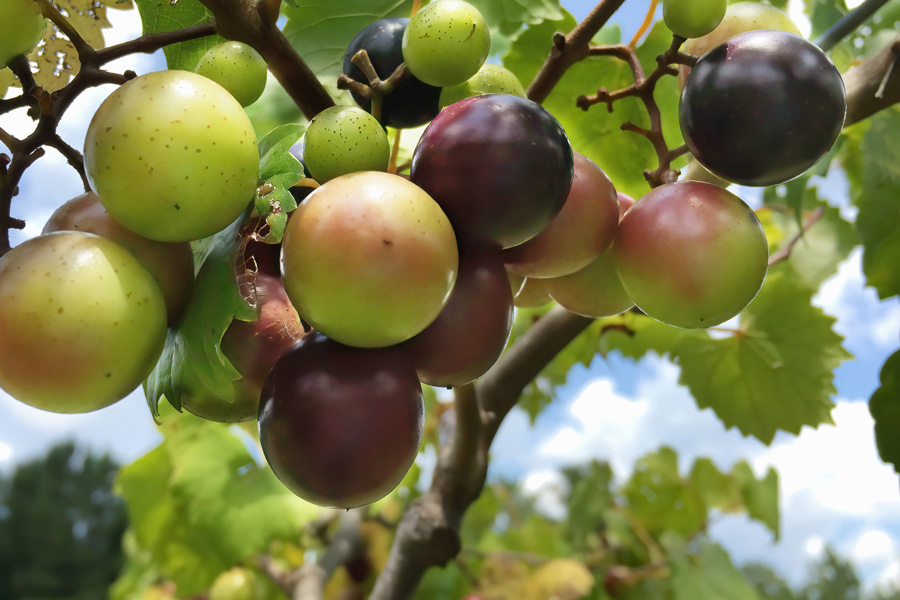
Muscadine Grape
Dry conditions resulted in virtually no disease pressure in most muscadine vineyards. When rots were observed, Macrophoma rot was the predominant “standard” disease observed. Black rot was observed on leaves, but this did not translate to fruit rots. Of interest, Phomopsis dead arm disease increased to epidemic levels in several vineyards, resulting in 50-75 percent losses in some varieties. The Granny Val variety has been particularly susceptible to this disease, and some producers are removing this variety completely from their vineyards. The combination of years of drought stress and cold damage could help explain the increase in this disease among certain varieties.
| Disease | % Reduction in Crop Value |
Damage ($ Thousands) |
Cost of Control ($ Thousands) |
Total ($ Thousands) |
| Bitter Rot | 1.0 | 18.2 | 40.2 | 58.4 |
| Macrophoma Rot | 1.0 |
18.2
|
35.0 | 53.2 |
| Ripe Rot | 1.0 | 18.2 | 15.0 | 33.2 |
| Angular Leaf Spot | 0.1 | 1.8 | 5.0 | 6.8 |
| Black Rot | 0.1 | 1.8 | —1 | 1.8 |
| Phomopsis Dead Arm | 5.0 | 90.0 | 5.0 | 95.9 |
| Total | 8.2 | 149.1 | 100.2 | 249.3 |
| 1 Controlled with fungicides applied for other diseases. Estimate by Phil Brannen, Extension Plant Pathologist |
||||
Ornamentals
The estimated value of the ornamental industry (excluding sod) was $1.473.2 million in 2001. Gross field and container nursery/greenhouse sales were estimated at $410.5 million with landscape industries (including re-wholesalers) making up the bulk of the total ornamental crop value. Root rot diseases account for the largest percentage of disease loss to ornamentals. Daylily rust, which was first seen in Georgia in fall 2000, became more widespread in 2001, which increased cost of control for nurseries, re-wholesalers and landscapers.
| Disease | % Reduction in Crop Value | Damage ($ Millions) |
Cost of Control ($ Millions) |
Total ($ Millions) |
| Bacterial diseases (fire blight, leaf spots) |
0.2 | 2.95 | 0.8 | 3.75 |
| Fungal leaf spots, branch and stem cankers | 0.5 | 7.37 | 6.3 | 13.67 |
| Root and crown rots | 2.3 | 33.88 | 8.1 | 41.98 |
| Powdery mildew | 0.2 | 2.95 | 1.8 | 4.75 |
| Botrytis blight | 0.1 | 1.47 | 1.0 | 2.47 |
| Virus (TSWV, INSV, CMV) | 0.05 | 0.73 | 0.0 | 0.73 |
| Minor diseases (rust, downy mildew, nematode) | 1.3 | 19.15 | 2.1 | 21.25 |
| Total | 4.65 | 68.5 | 20.1 | 88.63 |
| Production Category | % Reduction1 in Crop Value |
Damage ($ Millions) |
Cost of Control ($ Millions) |
Total ($ Millions) |
| Field Grown Stock | 2.8 | 1.90 | 2.0 | 3.90 |
| Containerized Nursery (including Liners) |
7.1 | 11.21 | 5.4 | 16.61 |
| Floriculture | 6.1 | 11.28 | 4.3 | 15.58 |
| Landscape | 2.8 | 25.71 | 5.6 | 52.87 |
| Re-wholesale | 12.8 | 18.43 | 2.8 | 21.23 |
| Total | 4.65 | 68.5 | 20.1 | 88.63 |
| 1 Values in this column are not additive and are calculated as the % reduction in crop value per grower category. Estimate by Jean Williams-Woodward, Extension Plant Pathologist |
||||
Peach
Peach production in 2001 was greatly reduced over its potential due to disease issues. The wet conditions observed in 2001 often resulted in increased disease and poor fungicide programs. Brown rot incidence was extremely high as was bacterial spot and scab. Problems with Armillaria root rot and phony peach were observed. Cost of control included cost of pesticides, equipment and labor. Costs associated with certain cultural practices (flail mowing to reduce gummosis, detailed pruning for control of Phomopsis shoot blight) are directly related to disease control and were, therefore, considered in the assessment.
| Disease | % Reduction in Crop Value |
Damage ($ Thousands) |
Cost of Control ($ Thousands) |
Total ($ Thousands) |
| Brown Rot | 10.0 | 4,279.0 | 1,500.0 | 5,779.3 |
| Scab | 5.0 | 2,139.6 | 1,110.0 | 3,249.6 |
| Bacterial Spot | 5.0 | 2,139.6 | 20.0 | 2,159.6 |
| Phony Peach | 1.0 | 427.9 | 230.0 | 657.9 |
| Gummosis | 0.1 | 42.8 | 20.0 | 62.8 |
| Armillaria Root Rot | 1.0 | 427.9 | 50.0 | 477.9 |
| Phomopsis Constriction Canker | 0.05 | 21.4 | 10.0 | 31.4 |
| Total | 22.2 | 9,478.2 | 2,940.0 | 12,418.5 |
| Estimate by Phil Brannen, Extension Plant Pathologist | ||||
Peanut
In 2001, peanut was planted on an estimated 515,000 acres and harvested from approximately 512,000 acres. Unlike during several recent drought years, growing conditions were generally good in 2001, and this was reflected in the statewide yields. Yields averaged 3,300 lb/A for a total production of 1.7 billion pounds, valued at $385,229,000. Ample rainfall across much of the production region early in the season led to the appearance of several uncommon foliar diseases including leaf scorch, anthracnose and leaf blight. Although premature defoliation was observed in some fields, these diseases had little if any impact on final yields. Leaf spot diseases, especially early leaf spot, were common and could be severe if not managed properly. Conditions early in the 2001 season were cooler and wetter than in recent years. These conditions were favorable for the development of Cylindrocladium black rot (CBR), which was a cause for concern for many growers and contributed to some significant yield losses across the state. White mold generally appeared during the latter part of the season and caused problems for growers who were not able to make late-season applications of fungicides such as Abound, Folicur or Moncut. These fungicides were also important for the adequate control of Rhizoctonia limb rot that was favored by thick vine growth and periods of ample rainfall. Tomato spotted wilt, the most devastating disease of peanut in Georgia in recent years, was generally very light in 2001 and caused only slight yield losses in most areas. Reasons for this included successful adaptation of the Tomato Spotted Wilt Index by growers and use of varieties such as Georgia Green and C-99R, which have some resistance to the virus.
| Disease | % Reduction in Crop Value |
Damage ($ Millions) |
Cost of Control ($ Millions) |
Total ($Millions) |
| Leaf spots | 2.0 | 7.7 | 42.2a | 31.9 |
| White mold | 3.0 | 11.5 | 11.6b | 23.1 |
| Limb Rot | 3.5 | 13.5 | —c | 13.5 |
| Pod Rot | 1.0 | 3.9 | —d | 3.9 |
| Nematodes | 3.0 | 11.5 | 8.0 | 19.5 |
| Cylindrocladium Black Rot | 3.5 | 13.5 | 0.25e | 13.75 |
| Seedling Disease | 0.5 | 1.9 | 0.5 | 2.4 |
| Tomato Spotted Wilt Virus | 1.5 | 5.8 | 0.0 | 5.8 |
| Diplodia Collar Rot | Trace | — | 0.0 | 0.0 |
| Total | 18.0 | 69.3 | 44.55 | 113.85 |
| a It was estimated that 55% of peanut acreage in Georgia receives some irrigation and that most of this acreage was sprayed with fungicides 7 times during the season. Fungicide treatments for leaf spot control alone are about $8/acre per application. Growers usually sprayed non-irrigated fields less often, perhaps 4-5 times per season. This figure is based upon the cost to growers if they ONLY used fungicides (e.g. chlorothalonil) for leaf spot control. b This figure reflects the additional cost BEYOND control of leaf spot if growers chose to use products such as azoxystrobin, tebuconazole, or flutolanil to control soilborne diseases. c Cost of control for limb rot is included in treatments for white mold. d The cost of gypsum treatments applied to reduce pod rot has not been estimated. e It was estimated that approximately 1% of the total peanut acreage is treated with metam sodium to control CBR at $50/A. Estimate by Robert Kemerait, Extension Plant Pathologist |
||||
Pecan
Abundant June-July rain resulted in some scab at a number of locations. Loss potential for 2001 was variable as usual ranging from <1 to >50 percent.1
| Disease | % Reduction in Crop Value | Damage ($ Millions) |
Cost of Control ($ Millions) |
Total ($ Millions) |
| Scab² | 0.15 | 0.09 | 12.10 | 12.19 |
| Brown Spot | 0.00 | 0.00 | —2 | 0.00 |
| Downy Spot | 0.00 | 0.00 | —2 | 0.00 |
| Powdery Mildew³ | Trace | 0.00 | —2 | — |
| Zonate Leaf spot | 0.00 | 0.00 | — | — |
| Total | 0.15 | 0.09 | 12.10 | 12.19 |
| 1 This data is based on the response of unsprayed trees (“Desirable”) in test plots. 2 Seven treatments on 150,000 acres @ $11.50/A; scab sprays also effective against downy spot, brown spot, and powdery mildew in most cases. Estimate by Paul Bertrand, Extension Plant Pathologist |
||||
Soybean
In 2001, soybean was planted on approximately 165,000 acres and harvested from an estimated 155,000 acres. Favorable weather during the growing season saw the average yield jump from 24 bu/A in 2000 to 27 bu/A in 2001. The total soybean production for Georgia in 2001 was 4,185,000 bushels with a value of nearly $18,000,000. Nematodes remain an important problem of soybean in Georgia; diseases are less important.
| Disease | % Reduction in Crop Value | Damage ($ Millions) |
Cost of Control ($ Millions) |
Total ($ Millions) |
| Soybean cyst nematode | 2.5 | 0.45 | 0 | 0.45 |
| Root-knot nematodes | 3.0 | 0.54 | 0 | 0.54 |
| Other nematodes | 0.2 | 0.04 | 0 | 0.04 |
| Anthracnose | 0.2 | 0.04 | 0 | 0.04 |
| Brown leaf spot | 0.1 | 0.02 | 0 | 0.02 |
| Charcoal rot | 0.0 | 0.00 | 0 | 0.00 |
| Diaporthe/Phomopsis complex | 0.1 | 0.02 | 0 | 0.02 |
| Downy mildew | 0.0 | 0.00 | 0 | 0.00 |
| Frogeye leaf spot | 0.2 | 0.04 | 0 | 0.04 |
| Red crown spot | 0.5 | 0.10 | 0 | 0.10 |
| Pod and stem blight | 0.1 | 0.02 | 0 | 0.02 |
| Purple stain | 0.1 | 0.02 | 0 | 0.02 |
| Seedling diseases (Rhizoctonia/Pythium/Fusarium) |
0.1 | 0.02 | 0.10 | 0.12 |
| Southern blight | 0.1 | 0.02 | 0 | 0.02 |
| Stem canker | 0.5 | 0.10 | 0 | 0.10 |
| Fusarium Wilt | 0.0 | 0.00 | 0 | 0.00 |
| Virus diseases | 0.0 | 0.00 | 0 | 0.00 |
| Bacterial diseases | 0.0 | 0.00 | 0 | 0.00 |
| Total | 7.7 | 1.43 | 0.10 | 1.53 |
| 1 Resistant varieties are used to manage most nematode and disease problems. Typically, the only fungicides used are seed treatments to reduce seedling diseases. Estimate by Robert Kermerait, Extension Plant Pathologist; Dan Phillips, Research Plant Pathologist |
||||
Strawberry
Commercial strawberry production continues to increase. This increase is observed in both U-pick and wholesale markets. Methyl bromide fumigation accounted for the largest single expenditure for disease control. With the impending loss of methyl bromide in 2005, control of soilborne strawberry diseases may become more difficult, and the expense of control is likely to increase as well. The disease pressure was relatively mild in 2001, largely due to dry weather conditions that resulted in low humidity during critical infection periods. Diseases observed in 2001 included root rots (especially black root rot), gray mold and anthracnose.
| Disease | % Reduction in Crop Value |
Damage ($ Thousands) |
Cost of Control ($ Thousands) |
Total ($ Thousands) |
| Gray Mold | 1.0 | 68.3 | 72.0 | 140.3 |
| Fungal Leaf Spots | 1.0 | 68.3 | 34.0 | 102.3 |
| Anthracnose | 2.0 | 136.7 | 4.0 | 140.7 |
| Root Rots & Nematodes | 3.0 | 205.0 | 50.0 | 255.0 |
| Angular Leaf Spot | 0.5 | 34.2 | 1.0 | 35.2 |
| Total | 7.5 | 512.6 | 161.0 | 673.5 |
| Estimated by Phil Brannen, Extension Plant Pathologist | ||||
Tobacco
Overall disease incidence was down in 2001. Blue mold appeared late (mid-late June) in several counties along the southern edge of the Georgia tobacco belt. Most affected fields were at or near the beginning of the sucker control program. Losses were minimal and very little acreage was treated with fungicide.
Black shank was present but less so than in 2000. Major losses were confined to a relatively few farms and were generally associated with non-use of Ridomil.
TMV was present but not in the extreme quantities as were seen in 2000. There was a significant planting of NC 297, which has TMV resistance; however, most acreage remained the NC 71 and NC 72, which were the main TMV victims in 2000.
TSWV was also generally less in 2001 than the previous 3-5 years. This appears due to a combination of less disease pressure and a 95 percent use of Admire treated plants. In spite of a generally lower incidence of TSWV in 2001, a dozen or so growers reported the highest incidence of TSWV ever seen on their operation or the particular farm where their 2001 crop was grown.
Target spot flared up following late June rain and caused some loss, particularly in the southern half of the Georgia belt.
| Disease | % Reduction in Crop Value |
Damage ($ Millions) |
Cost of Control ($ Millions) |
Total ($ Millions) |
| Blue Mold | Trace | 0.00 | 0.01 | 0.01 |
| Black Shank | 0.10 | 0.12 | 0.83 | 0.95 |
| Target Spot | 0.05 | 0.06 | 0.00 | 0.06 |
| Root-knot Nematode | Trace | 0.00 | 2.30 | 2.30 |
| TSWV1 | 1.50 | 1.74 | 0.87 | 2.61 |
| TMV | Trace | 0.00 | 0.00 | 0.00 |
| Total | 1.65 | 1.92 | 4.01 | 5.93 |
| 1 Results of 28 farm trials comparing Admire treated (14% TSWV) to untreated plants (19% TSWV) showed a 26% reduction with Admire treatment. Admire is estimated to be in use on 95% of Georgia tobacco. The % TSWV is the final % of stand lost to TSWV. Estimate by Paul Bertrand, Extension Plant Pathologist |
||||
Turf
It is estimated that there are 1.6 million acres of turf with the maintenance value of $1.56 billion in Georgia. Soilborne diseases are present wherever turf is grown and are responsible for much of the disease losses. Nematodes have been attributed to increased damage and stress. This stress has predisposed turfgrass to soilborne and foliar diseases. Soil test for nematode to verify problems. Foliage diseases continue to be problematic during hot, humid summers.
| Diseases | % Reduction in Crop Value |
Damage ($ Millions) |
Cost of Control ($ Millions) |
Total ($ Millions) |
| Soil Diseases | 3.9 | 60.84 | 31.20 | 92.04 |
| Foliage Diseases | 1.8 | 28.20 | 17.06 | 45.14 |
| Nematodes | 4.5 | 70.20 | 7.90 | 78.10 |
| Total | 10.2 | 159.12 | 56.16 | 215.28 |
| Estimate by Alfredo Martinez, Extension Plant Pathologist | ||||
Vegetables
About 197,000 acres of vegetables are grown in Georgia worth a total of ca. $666 million. TSWV in tomatoes and peppers was very low for both spring and fall crops. Hot, dry temperatures suppressed disease development in spring and early summer, thus reducing losses to fungal diseases. However, powdery mildew and gummy stem blight were very severe on watermelons in localized areas. Pepper anthracnose became a problem in some fields but was not a major problem across the state. Botrytis Neck Rot caused up to 30 percent loss in CA stored onions again in 2001.
| Major Vegetable Crops | % Reduction in Crop Value1 |
Damage ($ Millions) |
Cost of Control ($ Millions) |
Total ($ Millions) |
| Watermelon | 12.00 | 8.8 | 4.10 | 12.9 |
| Squash (yellow + zucchini) | 8.00 | 3.8 | 1.20 | 5.0 |
| Tomato | 7.00 | 5.8 | 2.10 | 7.9 |
| Other Vegetable Crops | % Reduction in Crop Value1 |
Damage ($ Millions) |
Cost of Control ($ Millions) |
Total ($Millions) |
| Pepper (bell) | 4.00 | 1.9 | 1.10 | 3.00 |
| Cucumber | 5.00 | 2.8 | 1.10 | 3.90 |
| Snap Bean | 6.00 | 2.8 | 0.72 | 3.52 |
| Greens | 3.00 | 0.93 | 0.84 | 1.77 |
| Cabbage | 8.50 | 2.5 | 0.33 | 2.83 |
| Onion (dry) | 14.00 | 13.2 | 1.90 | 15.10 |
| Cantaloupe | 6.00 | 1.1 | 0.93 | 2.03 |
| Eggplant | 6.50 | 0.79 | 0.16 | 0.95 |
| Total | 8.2 | 44.42 | 14.46 | 58.90 |
| 1 This column is not additive due to the way losses for vegetables are tabulated. Total values for vegetable commodities are taken from the 2000 farm gate values (SR-01-07). Estimated by David B. Langston, Jr., Extension Plant Pathologist |
||||
Wheat
Foliar diseases caused little damage to wheat during 2001 due to planting of resistant cultivars and a dry spring. Powdery mildew and leaf rust caused minor losses on susceptible cultivars. Stagonospora (Septoria) blotch was low due to dry spring weather. Symptoms occurred on leaves, but the glume blotch phase caused little damage. Tan spot, which causes leaf spot symptoms similar to Stagonospora blotch, was found in a few fields. Some growers applied foliar fungicides to control rust and other leaf diseases. As occurred in 2000, one grower experienced a near total crop loss due to stinking smut (common bunt). This is always a result of saving seed three or more consecutive years with no application of seed treatment. Stinking smut is entirely preventable with seed treatment and planting of Certified Seed.
Barley yellow dwarf was variable but generally low due to the cold fall and early winter that reduced aphid activity during the critical period for infection. There was a significant increase of dryland foot rot caused by Fusarium spp. This disease is more common in the western United States where wheat is grown under low rainfall conditions. The extended drought in Georgia over the past several years has favored this disease, which rots the roots and crown and causes premature death of upper leaves and interrupts grain filling. A number of fields were extensively damaged resulting in reduced yield and test weight below 55 lb/bu. Heavy rains during early June at the peak of harvest season caused severe physical damage to seed, which resulted in sprouting. Additional damage due to “field” fungi such as Alternaria, Fusarium and Helminthosporium also occurred, but direct losses are difficult to estimate. These fungi can cause poor seed germination. Although there were not reports of poor stand establishment from low quality seed, some seed lots intended for planting were rejected. Wheat was harvested on about 200,000 acres with an average yield of 53 bu/A for a total statewide production of 10.6 million bushels.
| Disease | % Reduction in Crop Value |
Damage ($ Millions) |
Cost of Control1 ($ Millions) |
Total ($ Millions) |
| Leaf Rust | 1.0 | 0.26 | 0.5 | 0.76 |
| Glume Blotch | 1.0 | 0.26 | — | 0.26 |
| Powdery Mildew | 0.2 | 0.05 | 0.2 | 0.25 |
| Barley Yellow Dwarf Virus | 1.0 | 0.26 | 0.1 | 0.36 |
| Foot rot | 2.0 | 0.54 | — | 0.54 |
| Stinking Smut | 0.05 | 0.02 | — | 0.02 |
| Total | 5.25 | 1.39 | 0.8 | 2.19 |
| 1 Fungicides used to control leaf rust also control Stagonospora blotch and powdery mildew. Estimated that 20% of the wheat acreage received fungicide or insecticide treatment costing approximately $13.50/acre. Estimate by Barry Cunfer, Research/Extension Plant Pathologist |
||||
Summary
| Summary of Total Losses Due to Disease Damage and Cost of Control | ||||||
| Crop or Commodity | Estimated Crop Value ($ Millions) | % Reduction in Crop Value | Value of Damage ($ Millions) | Cost of Control ($ Millions) | Total Disease Loss (Damage & Control) ($ Millions) | Total % of Loss 1, 2 |
| Apple | 2.05 | 11.8 | 0.271 | 0.238 | 0.507 | 24.73 |
| Blueberry | 13.55 | 4.1 | 0.578 | 0.740 | 1.318 | 9.73 |
| Bunch Grape | 1.97 | 17.0 | 0.334 | 0.085 | 0.419 | 21.26 |
| Corn | 63.4 | 14.6 | 9.24 | 1.0 | 10.24 | 16.16 |
| Cotton | 370.7 | 13.1 | 48.5 | 14.2 | 62.7 | 16.92 |
| Muscadine Grape | 1.82 | 8.2 | 0.149 | 0.100 | 0.249 | 13.68 |
| Ornamental | 1,473.2 | 4.65 | 68.5 | 20.1 | 88.63 | 6.02 |
| Peach | 35.03 | 22.2 | 9.478 | 2.94 | 12.418 | 35.02 |
| Peanut | 385.23 | 18.0 | 69.3 | 44.65 | 113.85 | 29.55 |
| Pecan | 60.0 | 0.15 | 0.09 | 12.10 | 12.19 | 20.31 |
| Soybean | 17.79 | 7.7 | 1.43 | 0.10 | 1.53 | 8.60 |
| Strawberry | 6.83 | 7.5 | 0.513 | 0.161 | 0.674 | 9.87 |
| Tobacco | 120.0 | 1.92 | 1.92 | 4.01 | 5.93 | 4.94 |
| Turf | 1,560.0 | 10.2 | 159.12 | 56.16 | 215.28 | 13.8 |
| Vegetable | 666.0 | 8.2 | 44.42 | 14.46 | 58.9 | 8.84 |
| Wheat | 21.73 | 5.25 | 1.39 | 0.8 | 2.19 | 10.08 |
| Totals | 4,799.3 | 8.65 | 415.233 | 171.844 | 587.107 | 12.23 |
| 1 This column is not additive. 2 Total % loss for each crop and the grand total is figured on the basis of: Value of Damage + Cost Control |
||||||
| Crop Value | ||||||
ATTENTION! Pesticide Precautions
- Observe all directions, restrictions and precautions on pesticide labels. It is dangerous, wasteful and illegal to do otherwise.
- Store all pesticides in original containers with labels intact and behind locked doors. “KEEP PESTICIDES OUT OF REACH OF CHILDREN.”
- Use pesticides at correct label dosage and intervals to avoid illegal residues or injury to plant and animals.
- Apply pesticides carefully to avoid drift or contamination of non-target areas.
- Surplus pesticides and containers should be disposed of in accordance with label instructions so that contamination of water and other hazards will not result.
- Follow directions on the pesticide label regarding restrictions as required by State and Federal Laws and Regulations.
- Avoid any action that may threaten an Endangered Species or its habitat. Your County Extension Agent can inform you of Endangered Species in your area, help you identify them and through the Fish and Wildlife Service Office identify actions that may threaten Endangered Species or their habitat.
Trade names are used only for information.