Poultry production is the number one agricultural business in the state of Georgia. The 2009 edition of “Georgia Poultry Facts” published by the National Agricultural Statistics Service revealed that the total farm value of poultry and eggs produced in the state increased by 8% to $3.94 billion for the 2008 production year. With more than 5,000 poultry farms in the state, it is clear that a large volume of poultry litter is generated each year. Of the 10.2 million tons of poultry litter generated annually in the U.S., Georgia generates approximately 2 million tons.
Over the years, poultry litter has been used for composting, pelletizing, and converting to electricity, steam and biogas; however, the most common use has been land application. Crop producers use poultry litter to add humus and nutrients to the soil. Farmers who cultivate cotton, corn, pecan, forages, tobacco, sorghum, pine forests and a variety of fruit trees use poultry litter to improve their soil fertility. These producers may use poultry litter as either the sole fertilizer or in combination with traditional inorganic fertilizers.
Poultry litter is a mixture of bedding material, manure, spilled feed and water. The nutrient content varies with the type of bird produced (i.e., broiler, pullet or breeder) and the number of flocks grown on the litter, but generally approximates a 3-3-2-grade fertilizer, which equates to a total of 60 pounds of nitrogen, 78 pounds of phosphate and 56 pounds of potassium on a per-ton basis. Not all nutrients in poultry litter are available to plants. About 60% of the nitrogen is available, 80- 100% of the phosphate is available and 100% of the potassium is available.
Poultry litter has an organic fertilizer value in excess of $80.00 per ton based on current fertilizer prices (Ritz and Merka, 2009). When Gascho et al. (2001) looked at poultry litter use in the Southern Coastal Plains based on the value of a harvested crop, a ton of stack-house broiler litter added $103.74 acre per year to the crop value. They also found that broiler litter application increased phosphorus, potassium, calcium, magnesium, zinc, manganese and copper concentrations in the surface soil. Armed with this information, a survey was conducted to assess the value and utilization of poultry litter among south Georgia poultry and crop producers.
The Survey Process
Litter utilization surveys were distributed at UGA Cooperative Extension meetings held for crop producers in 64 counties across South Georgia. A total of 23 questions were compiled and a total of 165 farmers responded. The questions were designed to target crop producers who were using or had used poultry litter as a source of nutrients. Not all respondents answered all questions because some did not utilize poultry litter.
The total acreage of land under cultivation varied widely among the farmers but averaged 1,000 acres, with the smallest farm being 4 acres and the largest being 6,000 acres. Because crop producers in South Georgia mainly use broiler litter, table egg layer manure use was omitted from the questionnaire.
Summary of Findings
Soil Type
Three major soil types are used for agricultural production in South Georgia: coastal plain, deep sand and piedmont. The type of soil on each farm was of interest because poultry litter is an excellent source of humus, which binds soil particles together and improves soil’s water holding capacity. The results from the questionnaire showed that 65.92% of respondents farmed on coastal plain soil, 25.70% farmed on deep sand soil and 8.38% farmed on piedmont soil (Fig. 1). Some respondents had more than one soil type on their farm. The use of inorganic and organic fertilizer did not differ by soil type.
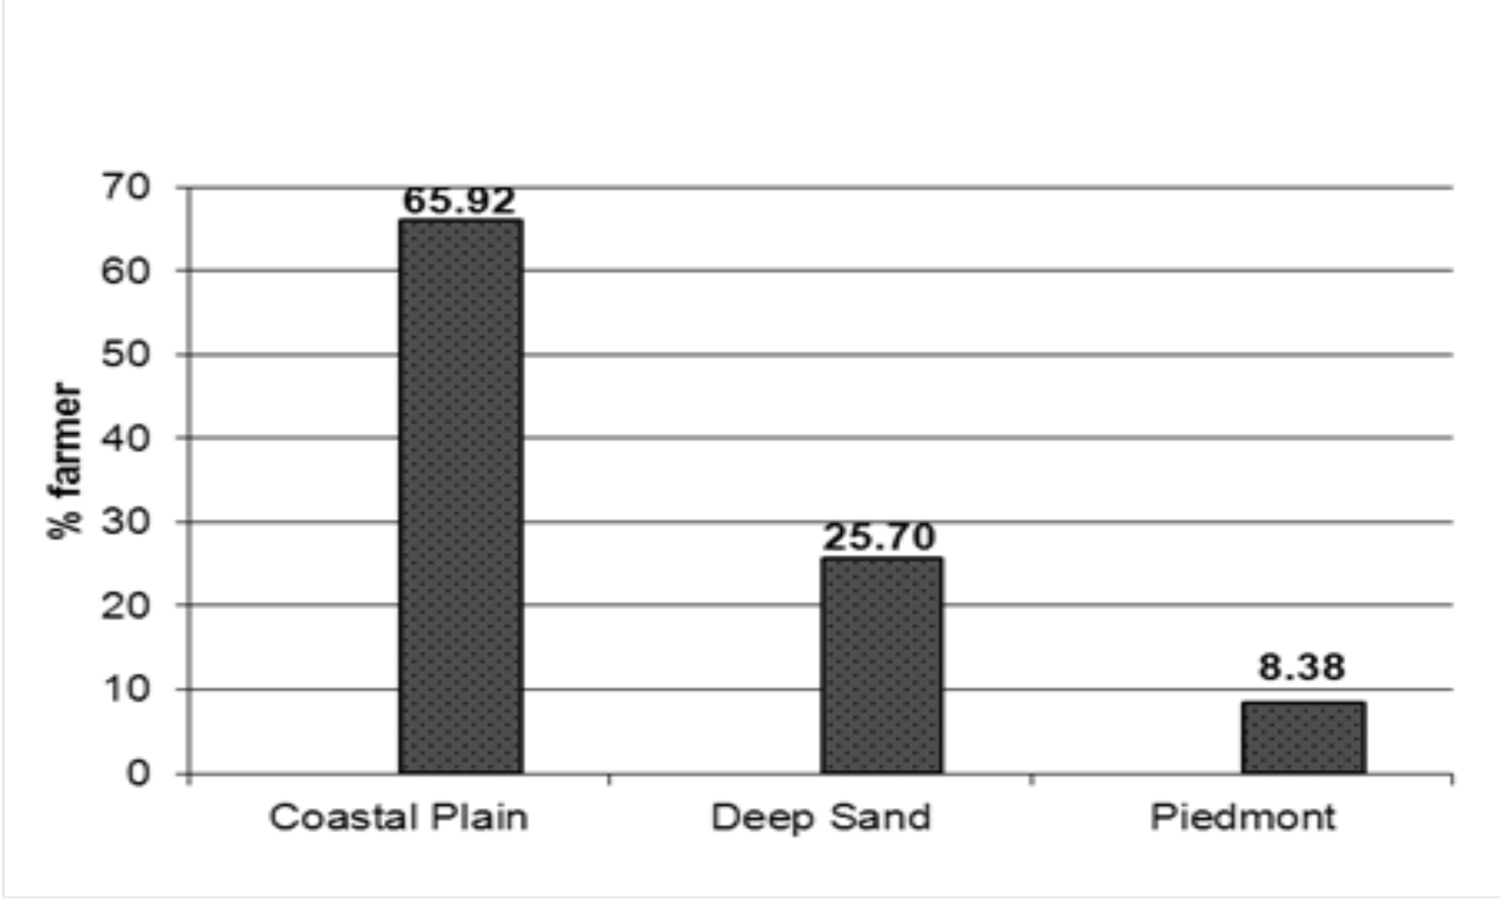 Figure 1. Percentage of farms with coastal plain, deep sand and piedmont soil.
Type of Crops Grown
The types of crop farmers grew were important because of the specific nutrients each would obtain from the poultry litter. The survey results (Fig. 2) showed that 75.49% of respondents grew tree and row crops (specifically pecans, peanuts, cotton and corn). A total of 18.14% of respondents grew tobacco and forages such as sorghum and rye grass. Vegetables were grown by 6.37% of respondents. The results were not divided into specific crop types.
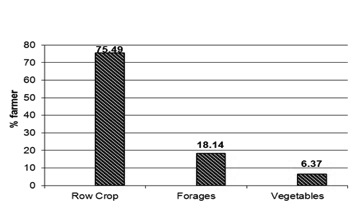 Figure 2. The percentage of farmers growing row crops, forages and vegetables.
Use of Poultry Litter and Inorganic Fertilizer
Of the 165 respondents, 50.30% utilized poultry litter as a source of nutrients in their production while 49.70% did not use poultry litter (Fig. 3). Of the total number of growers who used poultry litter, 40% had been using it for less than three years, 26.25% had used it for four to six years and the remaining 33.75% had used it for more than six years (Fig. 4).
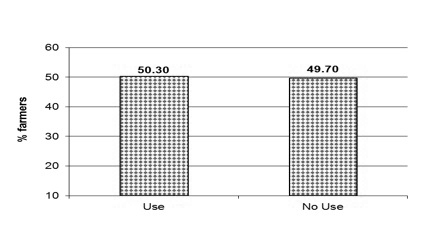 Figure 3. The percentage of South Georgia farmers who do and do not utilize poultry litter.
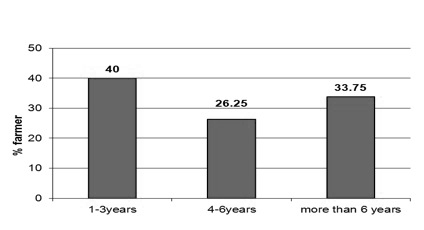 Figure 4. The percentage of farmers who have been using poultry litter for one to three years, four to six years and more than six years.
When asked if inorganic fertilizer was used as a source of nutrients, 77.54% of respondents said yes while 22.46% said no (Fig. 5).
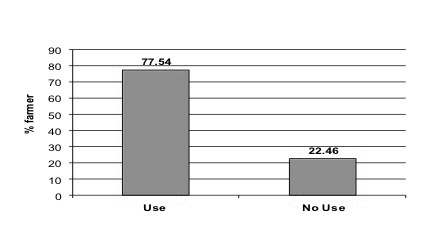 Figure 5. The percentage of farmers who used inorganic fertilizers versus those who did not.
A total of 75.64% of the growers who used poultry litter also used inorganic fertilizer while 24.26% of crop producers used poultry litter as their only source of nutrients (Fig. 6).
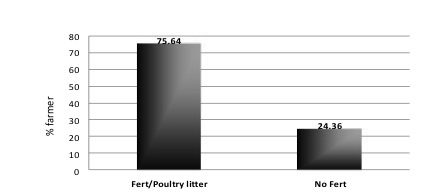 Figure 6. The percentage of farmers who used poultry litter and inorganic fertilizer versus those who only used poultry litter.
When asked whether they used a combination of poultry litter and inorganic fertilizer, 34.48% of respondents said they used both at the same time while 65.52% indicated they did not.
Source of Litter
Poultry manure can come from the variety of sources such as layer houses, broiler houses, breeder houses and pullet houses. The survey results showed that more than 38% of the growers used litter from broiler houses; only 6% used litter from breeder houses (Fig. 7). A total of 6% of growers utilized litter from both broiler and breeder houses. Less than 2% of producers were unsure about the litter source.
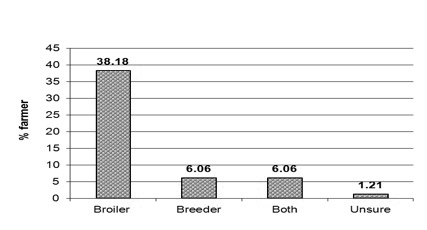 Figure 7. The percentage of growers who obtained litter from broiler houses, breeder houses or both, or who were unsure of the litter source.
Composting poultry litter can be beneficial because the heat generated during the composting process can reduce the bacterial load. The survey results showed that 65.52% of growers removed litter directly from the poultry houses and placed it onto their fields while fewer than 35% indicated that their litter was composted before application (Fig. 8).
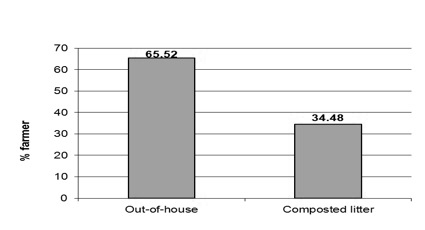 Figure 8. The percentage of litter that is composted before land application versus litter obtained and applied directly from the poultry house.
A wide variety of materials can be used as bedding in poultry houses. The material that is selected often depends on availability and cost. In South Georgia, sawdust, wood shavings and peanut hulls are the most common bedding materials. Rice hulls, paper pulps and sand can also be used but none of the respondents in this survey utilized them. When asked what material was used in the bedding, 39% of respondents used wood shavings, 35% used peanut hulls, 23% used sawdust and 3% did not know.
The survey also compared the frequency of litter and inorganic fertilizer applications. The data showed that 41.72% of respondents applied litter once per year compared to 45.70% of farmers who used inorganic fertilizer (Fig. 9). Only a small percentage of inorganic fertilizer users (0.66%) and poultry litter users (1.32%) applied treatment less than once per year. Compared to litter users (2.65%), respondents who applied inorganic fertilizer (7.95%) did so more than once per year.
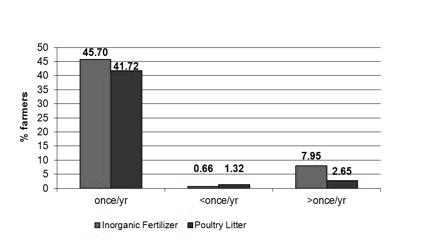 Figure 9. The percentages of growers who applied poultry litter or inorganic fertilizer less than once, once or more than once per year.
The amount of fertilizer and poultry litter farmers apply to their land each year and the amount of money paid for these amendments is an indicator of the amount of money involved in fertilizing the soil. Since not all crop producers cultivate all of their land each year, respondents were asked to indicate the amount of litter and fertilizer they applied per acre. Of the farmers who used fertilizer, 33.69% applied up to 250 pounds per acre (Fig. 10). Almost half (49.06%) applied 251-500 pounds per acre, and 16.99% applied more than 500 pounds per acre. The amount and type of fertilizer used depended on the type of crop planted.
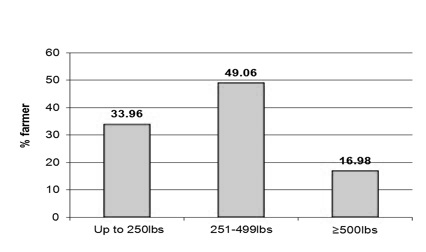 Figure 10. The percentage of growers who applied less than 250 pounds, between 251 and 499 pounds and more than 500 pounds of inorganic fertilizer per acre.
Cost of Fertilizer Use
Farmers who used inorganic fertilizer paid a variety of prices depending on the type of fertilizer purchased, from up to $500 per ton (46.67%) to $600-$1,000 per ton (46.67%) to more than $1,000 per ton (6.67%) (Fig. 11). Responses indicated that 14.29% of growers used nitrogen fertilizer, 1.79% used potash and the remaining 83.93% applied mixed fertilizer. None of the respondents applied phosphate fertilizers.
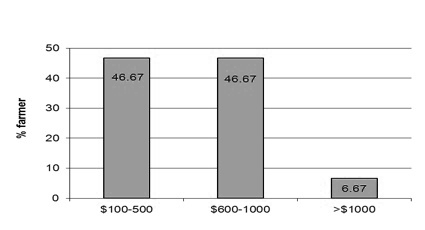 Figure 11. The percentage of growers who paid $100- $500, $600-$1,000 or more than $1,000 for inorganic fertilizer each year.
The amount of litter applied to the soil depended on the crop, with more litter applied to land on which cotton or other row crops were grown. Figure 12 shows that the majority of crop producers (92.86%) applied more than 1 ton of poultry litter per acre, while only 7.14% applied 1 ton per acre.
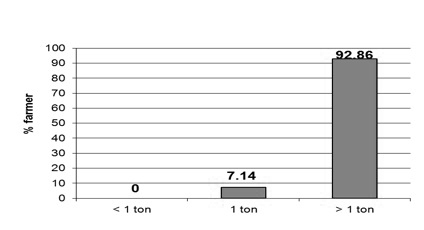 Figure 12. Tons of litter applied per acre.
Cost of Poultry Litter
Respondents were asked how much they paid for litter, and the cost ranged from $10 to $55 per ton. The results showed that 27.42% of growers bought litter for $10-20 per ton while 43.55% purchased litter for $21-35 per ton. Just over 29% bought litter for more than $35 per ton (Fig. 13). The wide variation in prices paid for poultry litter could be the result of differences in availability, transportation and handling costs as well as lack of information on poultry litter’s value. It is also important to note that although a question addressing this issue was not included in the survey, some of these crop producers also owned poultry or received poultry litter from family members who were poultry producers.
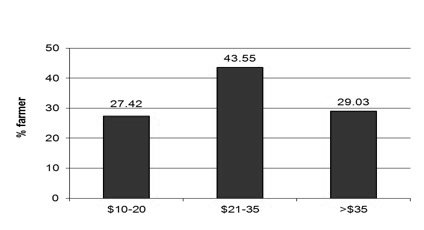 Figure 13. Growers paid anywhere from $10 to more than $35 per ton for poultry litter.
Acreage Under Cultivation
Crop growers in South Georgia usually cultivate large acreages. The following results place the respondents into five groups based on the amount of land on which they applied inorganic or organic (litter) fertilizer. Figure 14 shows that 25.83% of respondents applied some form of soil amendment to up to 250 acres, 22.5% fertilized 251-500 acres, 10% fertilized 501-700 acres and 10% fertilized 701-1,000 acres; 31.67% fertilized more than 1,000 acres with inorganic fertilizer, poultry litter or both.
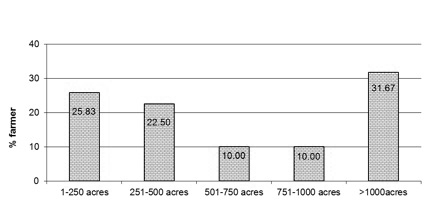 Figure 14. The percentage of growers who fertilized between 1 and more than 1,000 acres of cultivated land at the time of the survey.
Crop Yield Using Poultry Litter
Producers use soil test results to decide on the type of fertilizer they will apply to their land. The results from this survey showed that 100% of producers who utilized inorganic fertilizers tested the soil prior application. In contrast, 89.23% of producers who used poultry litter tested their soil prior to application while 10.77% of litter users did not test their soil before they applied litter.
Inorganic fertilizers usually clearly label their nutrient content or ratio of ingredients. The same is not true for poultry litter and other organic fertilizer sources. The nutrient content of poultry litter can be obtained by sending a litter sample to a lab. When asked if the litter was analyzed prior to use, 74.58% of respondents said yes while 25.42% said no.
There are numerous reasons why crop producers utilize poultry litter, including according to the survey crop yield. When asked to compare the yields of crops fertilized using poultry litter to those using inorganic fertilizers, 49.15% of respondents indicated that crop yield was equal regardless of the nutrient source; however, 45.76% reported that poultry litter produced better yields than inorganic fertilizer and 5.08% said it was less (Fig. 15). These reports were similar to those published by Gascho et al. (2001), who observed that litter application increased cotton, pearl millet, wheat and canola yields while reducing peanut yields.
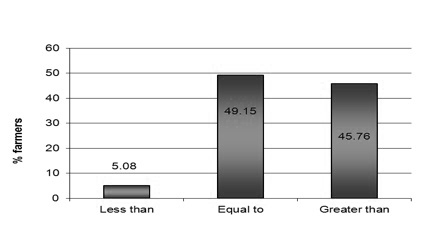 Figure 15. The percentages of growers who indicated that crop yield was equal regardless of nutrient source, and those who indicated that poultry litter produced yields less than or greater than inorganic fertilizers.
While poultry litter has benefits as an organic fertilizer, it is not always readily available and some crop producers will have to travel great distances to obtain it. The results from this survey showed that 24.03% of litter users travel up to 20 miles to get the litter while 41.09% of inorganic fertilizer users travel the same distance to obtain inorganic fertilizer (Table 1). Only 6.98% of litter users traveled 21-50 miles to obtain their fertilizer compared to 10.85% inorganic fertilizer users. However, when the distance increased to 51- 100 miles, 4.65% of litter users traveled this distance compared to only 0.78% of inorganic fertilizer users. About 11% of litter users traveled over 100 miles to obtain poultry litter compared to 0.78% of inorganic fertilizer users who traveled that distance.
Table 1. Percent of growers who traveled various distances to obtain litter or inorganic fertilizer.
| Type of Fertilizer | Distance Traveled (in miles) | |||
| 0-20 | 21-50 | 51-100 | >100 | |
| Poultry Litter | 24.03% | 6.98% | 4.65% | 11.0% |
| Inorganic Fertilizer | 41.09% | 10.85% | 0.78% | 0.78% |
Application of Litter
How the litter is spread and who spreads it can impact the final cost. A total of 44.93% of respondents who used litter applied it pre-plant compared to 42% who incorporated it and 13% who strip-tilled it (Fig.16). More respondents spread the litter themselves (58.33%) rather than have someone else spread it for them (41.67%) (Fig. 17).
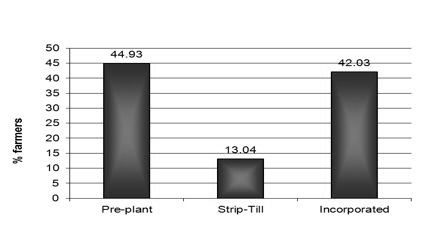 Figure 16. The percentage of growers who applied poultry litter pre-plant, by strip-till or who incorporated it.
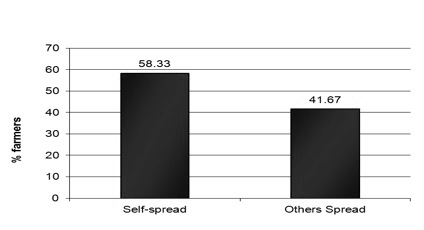 Figure 17. The percent of growers who self-spread the litter compared to those who had others spread it for them.
One unfavorable impact of litter application is that of neighbor relationships. There are often complaints about the odor, particulate matter and insects that can be associated with freshly spread litter. A total of 55.56% of respondents said they received complaints from their neighbors while 44.44% said they did not (Fig. 18)
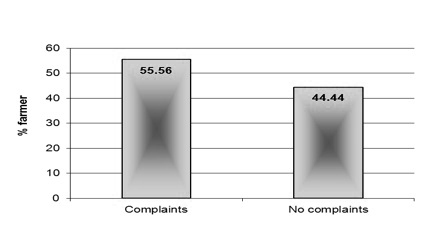 Figure 18. The percentage of growers who said they either did or did not have odor complaints from neighbors.
Summary
- On average, poultry litter contains 60 pounds of nitrogen, 78 pounds of phosphorous, and 56 pounds of potassium, per ton.
- Poultry litter has a computed fertilizer value in excess of $80.00 per ton.
- Poultry litter has practical value to a variety of crop producers:
- 50% of crop producers in South Georgia use poultry litter; 24% use it as their only source of fertilizer.
- Most crop producers use poultry litter at a rate of 2 tons per acre.
- Crop producers spend a substantial amount of money on inorganic fertilizers each year, with more than half of these surveyed spending $600 to $1,000 per ton per year.
- Crop producers apply fertilizer to large acreages each year, the cost of which varies based on the type of fertilizer.
- With only about 50% of producers using poultry litter, opportunities exist for more application. The lack of more widespread use could be a result of unavailability of litter or the lack of information on the value of poultry litter as a fertilizer.
- Approximately 45% of respondents indicated that applying poultry litter improved yield.
- Crop producers utilizing litter indicated a willingness to travel great distances to obtain it.
- The percentages of complaints from neighbors indicate a need for use of best management practices for poultry litter application.
References
Gascho, G.J., Hubbard, R.K., Brenneman, T.B., Johnson, A.W., Sumner, D.R., and Harris, G.H. 2001. Effects of broiler litter in an irrigated, double-cropped, conservation-tilled rotation. Agron. J. 93:1315-1320.
NASS – National Agricultural Statistics Service. 2009. Georgia poultry facts 2009 edition. USDA, NASS, Georgia Field Office.
Ritz, C. W. and W. C. Merka. 2009. Maximizing Poultry Manure Use Through Nutrient Management Planning. University of Georgia Cooperative Extension Bulletin 1245.