- Precooling Methods
- Cooling Method Selection Criteria
- Refrigeration Load Calculation
- Summary
- References
Fruits and vegetables begin to deteriorate after they
are harvested and separated from their growing
environment. The rate of deterioration defines how
long they will be acceptable for consumption. This is
known as “shelf life.” To preserve the quality of fruits
and vegetables and maximize profits for growers, it
is critical to control the temperature of fresh produce
and minimize the amount of time that products are
exposed to detrimental temperatures.
Both temperature and relative humidity are important
during the postharvest handling of fruits and vegetables.
Heat, in particular, decreases produce quality and
reduces market shelf life. Heat damage can come from
two interrelated sources: the fieldâ??s temperature at harvest
and the produceâ??s natural respiration. High field
temperatures raise product temperatures; therefore, it
is important to cool produce as rapidly as possible to
avoid tissue damage. Some products that are sensitive
to temperature abuse can experience excessive weight
loss when field temperatures are too high. Some growers
harvest their products at night to avoid excessive
daytime heat. The second source of heat comes from
natural respiration. Fruits and vegetables are still alive
after they are harvested and they react with oxygen
to form carbon dioxide, water and heat. Although this
“heat of respiration” varies with different fruits and
vegetables, in general as product temperature increases,
respiration and heat generation also increase,
shortening the shelf life. Heat generation may be
expressed as British thermal units (Btu). Typical rates
of heat respiration for different fruits and vegetables at
various temperatures can be found in Table 1.
Relative humidity also affects the quality and shelf life
of fruits and vegetables. Moisture loss is increased by
low relative humidity and is a major cause of deterioration.
Fruits and vegetables contain 80 to 85 percent
water. The relative humidity (RH) of the intercellular
spaces of fruits and vegetables is approximately 99
percent. If the air surrounding the product has humidity
less than 99 percent, moisture will move out of the
plant tissue into the air. Keeping the humidity high in
the storage environment is the best method to reduce
moisture loss. Waxing, trimming and packing produce
in plastic bags can also reduce moisture loss. Recommended
storage temperatures, relative humidity, storage
life, freezing points and specific heat guidelines for
various fruits and vegetables can be found in Table 2.
Several precooling methods can be used to reduce
field heat and heat of respiration. Current practices
include room cooling, forced-air cooling, hydrocooling,
package-icing and vacuum cooling. In this publication,
precooling is defined as a cooling process that quickly
removes heat from products after harvest and before
storage or shipping. The terms “precooling” and “cooling”
are used interchangeably.
Precooling Methods
Room cooling
Room cooling is a common and simple precooling
method that exposes produce to cold air in a refrigerated
room. Room cooling is usually used for products
that have a relatively long storage life, such as sweet
potatoes, apples and pears. These products are cooled
and stored in the same room. In general, a simple and
effective arrangement is to discharge cold air into
a cooling room horizontally just below the ceiling.
The air sweeps the ceiling and returns to the cooling
coils after circulating through the produce on the
floor. There should be enough refrigerated air volume
to provide adequate cooling. The air velocity should
be kept between 200 and 400 feet per minute around
and between cooling containers. When cooling is
complete, air velocity should be reduced to the lowest
level that will keep produce cool â?? usually 10 to 20
feet per minute.
One benefit of room cooling is that both the cooling
and storage can be done in the same room and the produce
does not need to be re-handled. In addition, room
cooling requires a lower refrigeration load than other,
faster cooling methods, as explained later.
However, room cooling has several major disadvantages
that may limit its use. First, at 20 to 100 hours to
cool the product to the seven-eighths cooling temperature
(as explained later), room cooling is too slow for
most commodities, particularly with containers that
have minimal open air spaces. Second, it requires a
relatively large empty floor space between stacked
containers to achieve an optimal cooling effect. Third,
it may cause serious water loss for fresh produce due
to high air velocities (although air velocity in room
cooling should be lower than in forced-air cooling).
Fourth, it is difficult to maintain control of the cooling
process. Produce in newer, more-closed containers (or
in containers tightly stacked on pallets) is particularly
hard to cool through room cooling. Because of these
limitations, the produce industry is increasing the use
of faster cooling methods to protect more perishable
produce and to facilitate shipping soon after harvest.
Forced-air cooling
Forced-air cooling is the most widely used precooling
method in commercial practice. It is particularly
popular among small operations because of its ability
to handle a wide variety of products. It can rapidly aircool
produce by creating an air pressure difference on
opposite faces of stacks of vented containers (Figure
2). This pressure difference forces air through the
stacks and carries heat away.
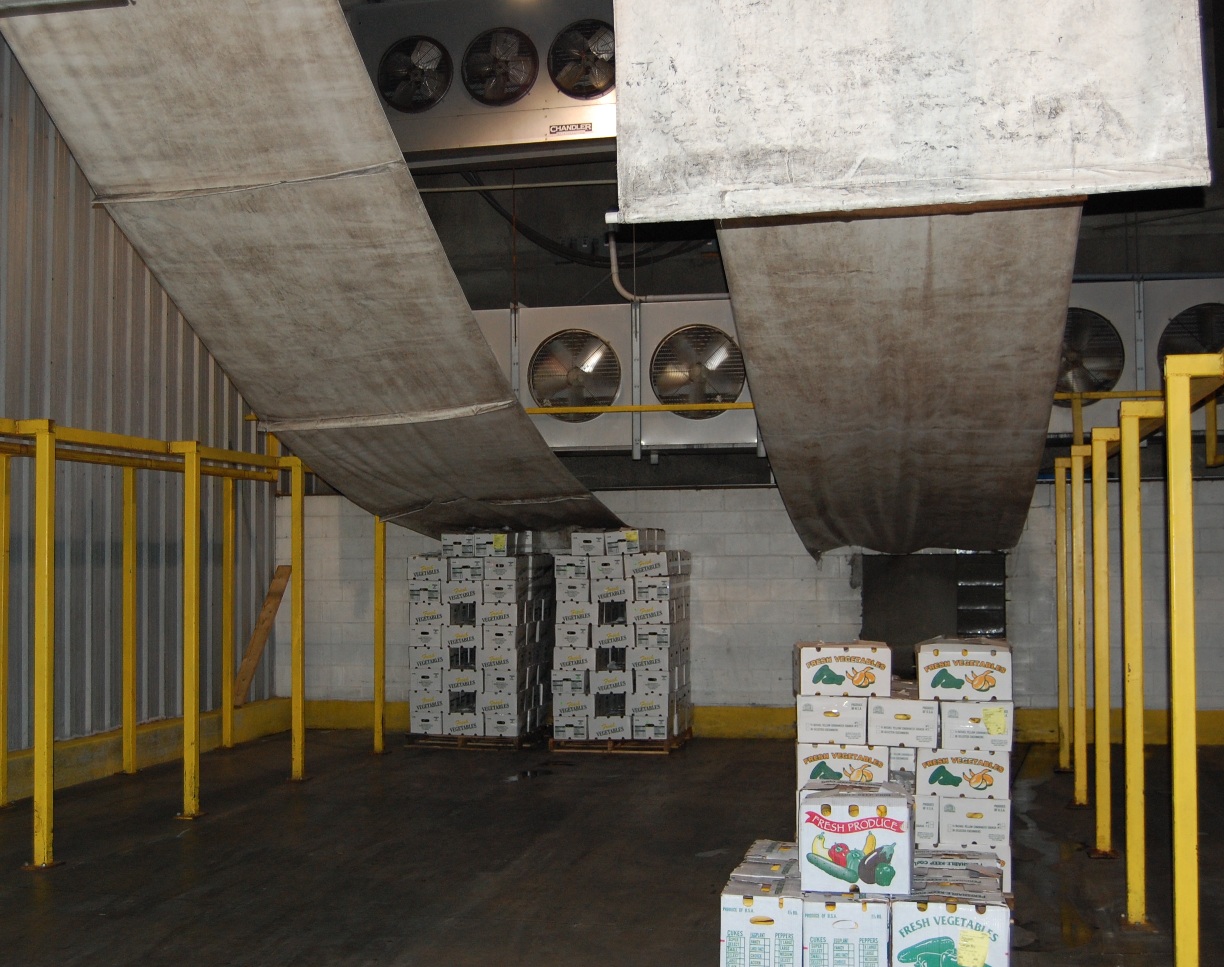 Figure 1. A typical commercial tunnel-type forced-air cooling
system in Georgia (Courtesy of Lewis Taylor Farm).
Forced-air cooling has several advantages over room
cooling. For instance, forced-air cooling is much faster
than room cooling because the cold air generally cools
the produce by flowing around the individual fruits or
vegetables in the containers. Forced-air cooling usually
cools fresh produce in one to ten hours, which is
one-tenth the time needed for room cooling. Second,
adjusting the volume of air can control the cooling
speed. Rapid cooling can be accomplished with
adequate refrigeration and a large volume of airflow
per unit of produce. Third, an existing room cooling
system can be converted to forced-air, which could
reduce capital costs if enough refrigeration capacity is
available from the existing room cooling system.
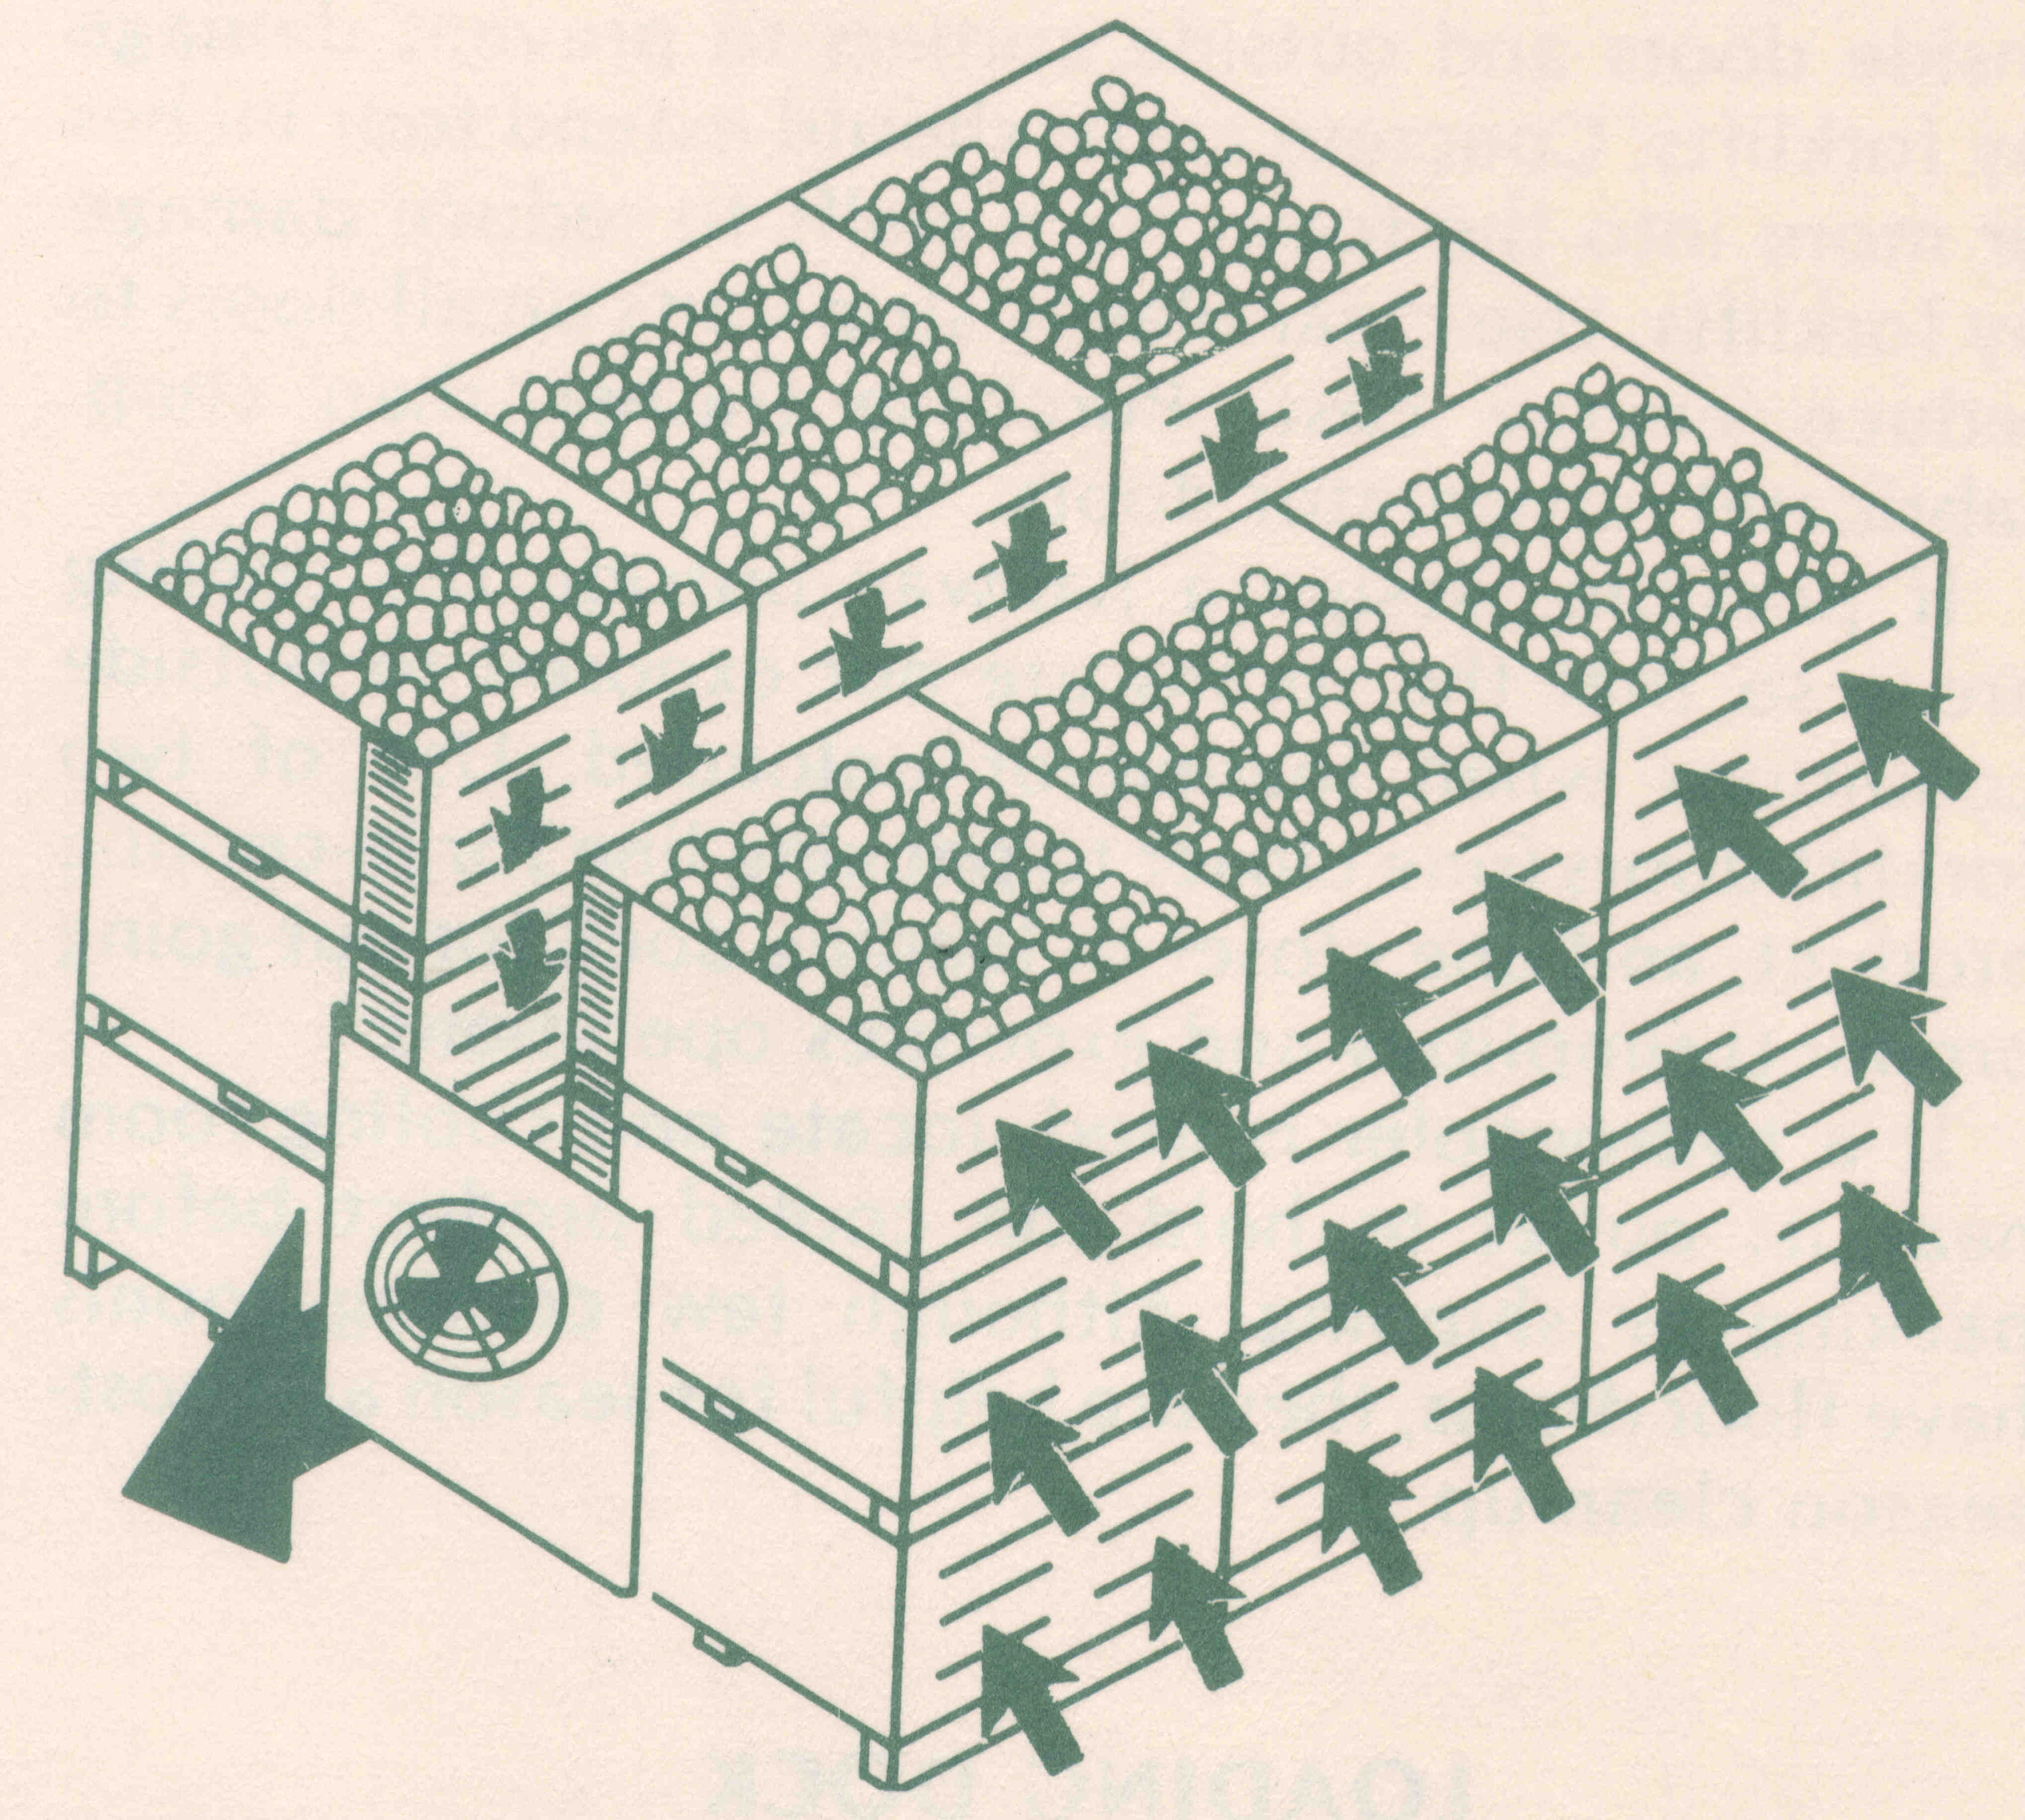 Figure 2. Schematic diagram of airflow in forced-air cooling.
Proper placement of containers and use of baffles blocks air
return everywhere except through side vents in containers.
Thus, air is forced to pass through containers and around
produce to return to exhaust fans. As air is exhausted from
the center chamber, a slight pressure drop occurs across
the produce.
One drawback of forced-air cooling is that it can cause
water loss from the fresh produce due to air movement
unless humidity is kept near 100 percent. To reduce
water loss, fresh produce should be cooled as quickly
as possible after harvest using high airflow rates. For a
forced-air system to work effectively, at least 4 percent
of the carton area should be vented to allow airflow.
Vents should be vertical slots at least ½-inch wide that
extend to within 1 1/2 inches of the top and bottom of
container.
Various stacking arrangements can be made for a
forced-air cooler. In tunnel-type forced-air cooling,
the product is stacked in two rows far enough apart to
accommodate the fans with the tarp covering the gap
between the rows (both on top of the rows and at the
end away from the fan) as shown in Figures 1 and 2.
When the product is adequately cooled, the fan should
be turned off and the tarp should be rolled up. Other
forced-air cooling arrangements include cold wall,
serpentine cooling and evaporative forced-air cooling.
Hydrocooling
Hydrocooling is one of the fastest precooling methods.
Fruits and vegetables can be cooled rapidly by bringing
them in contact with cold moving water (Figure 3).
One main advantage of hydrocooling is that it does not
remove water from the produce and may even revive
slightly wilted produce. For efficient hydrocooling,
water should come in contact with as much of the surface
of each fruit or vegetable as possible. Water also
must be kept as cold as possible without endangering
produce. In commercial practices, water temperature is
usually kept around 31°F except for chilling sensitive
commodities.
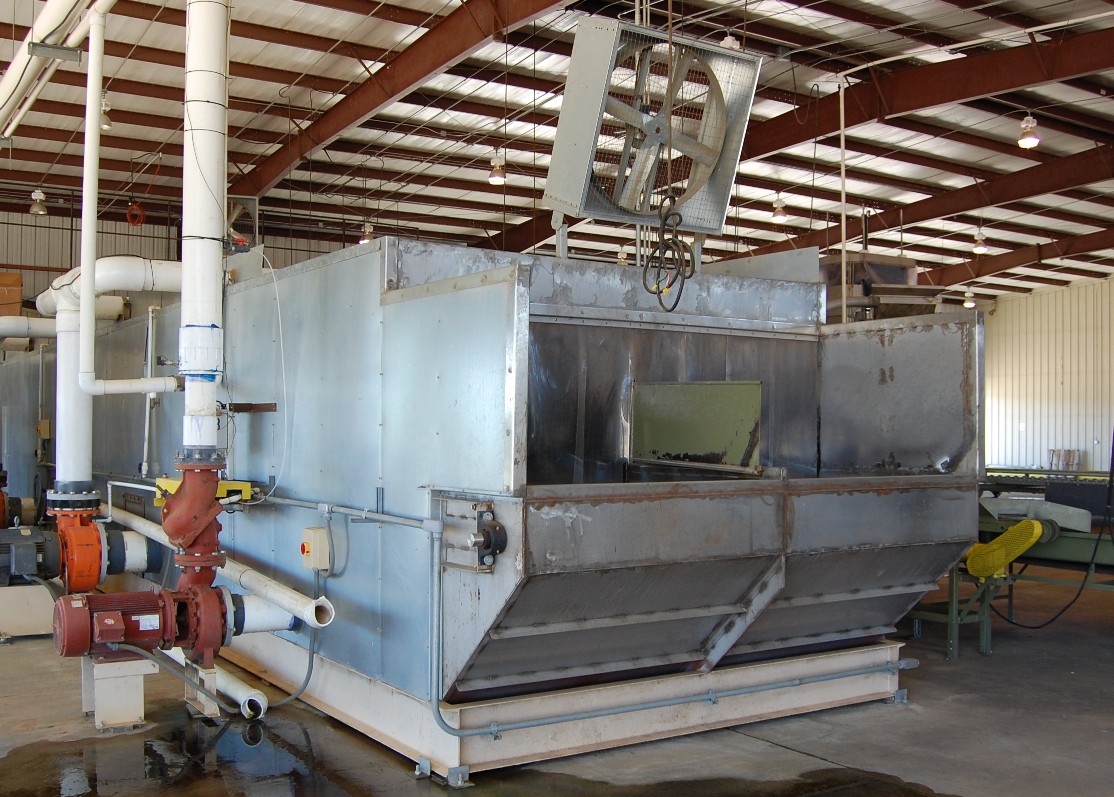 Figure 3. A commercial hydrocooler in Georgia (Courtesy of
Lewis Taylor Farm).
Conveyor hydrocoolers are the most common. Produce
in bulk or in containers is carried on a conveyor
through a shower of water. To avoid “channeling”
(water pouring through larger openings where there
is less resistance), it is necessary to either use a heavy
shower over a shallow depth of produce or proportion
the shower and the drainage from the bottom of containers
so that the containers fill partly or entirely with
water. Drainage must be sufficient to keep the water in
the containers moving and to remove all water before
containers leave the hydrocooler.
To achieve optimal cooling and save energy, hydrocoolers
should be insulated. Tests have showed that
less than half of the refrigeration used in most conveyor-
type hydrocoolers was lost due to insufficient
insulation.
Despite advantages such as a fast cooling rate and no
water loss in fresh produce, hydrocooling does have
disadvantages. First, both the product to be cooled and
the containers must withstand wetness and chemicals
such as chlorine. Second, due to limited capacity,
some arriving produce may have to wait in a warmer
environment if the cooler has reached its maximum
capacity (this limitation can be mitigated by placing
the hycrocooling facility inside a cold room). Third,
re-handling cooled products is usually needed for
either immediate shipping or transferring the produce
to a cold storage room. Although there are some food
safety concerns related to hydrocooling, properly using
active chlorine or ozone to disinfect the water used
in the process can reduce the potential risk of spreading
any contamination.
Package-icing
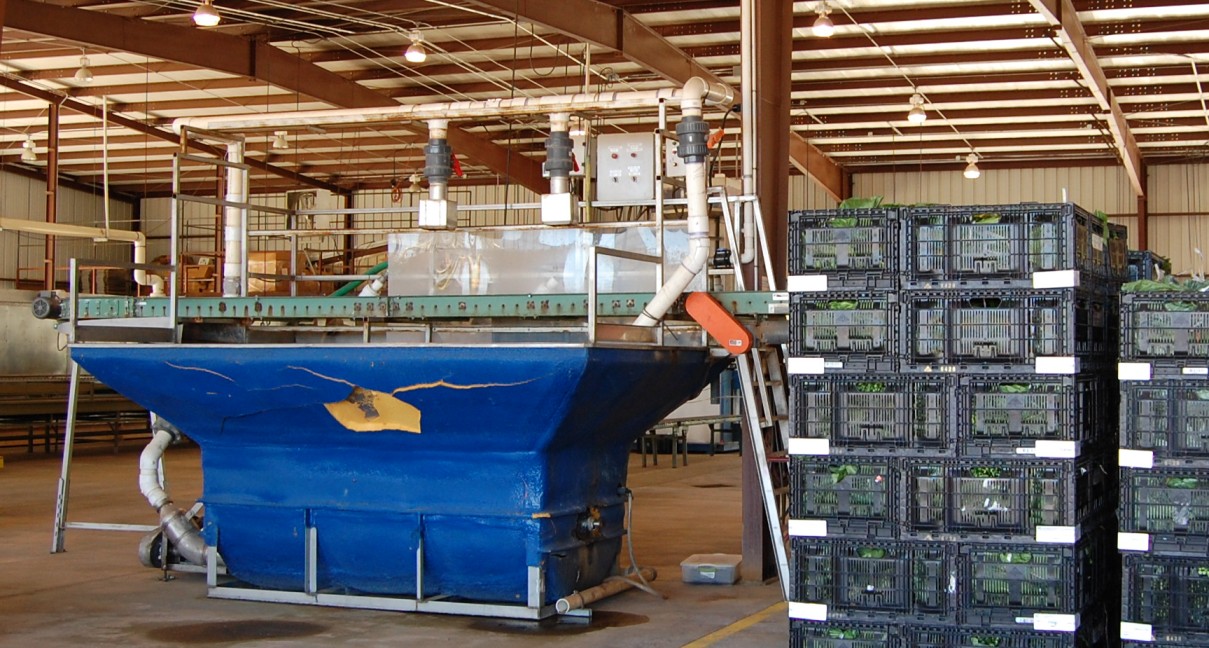 Figure 4. A slush ice type of package-icing cooler in Georgia
(Courtesy of Lewis Taylor Farm).
Packing crushed ice in containers with produce is
one of the oldest and fastest cooling methods, and is
particularly useful for cooling field-packed vegetables
such as broccoli. It offers the advantage of fast cooling
when the product directly contacts the ice, although
the cooling rate could be significantly reduced when
the ice melts. Another advantage is that the excess ice
on the top of the product provides cooling during and
after transportation.
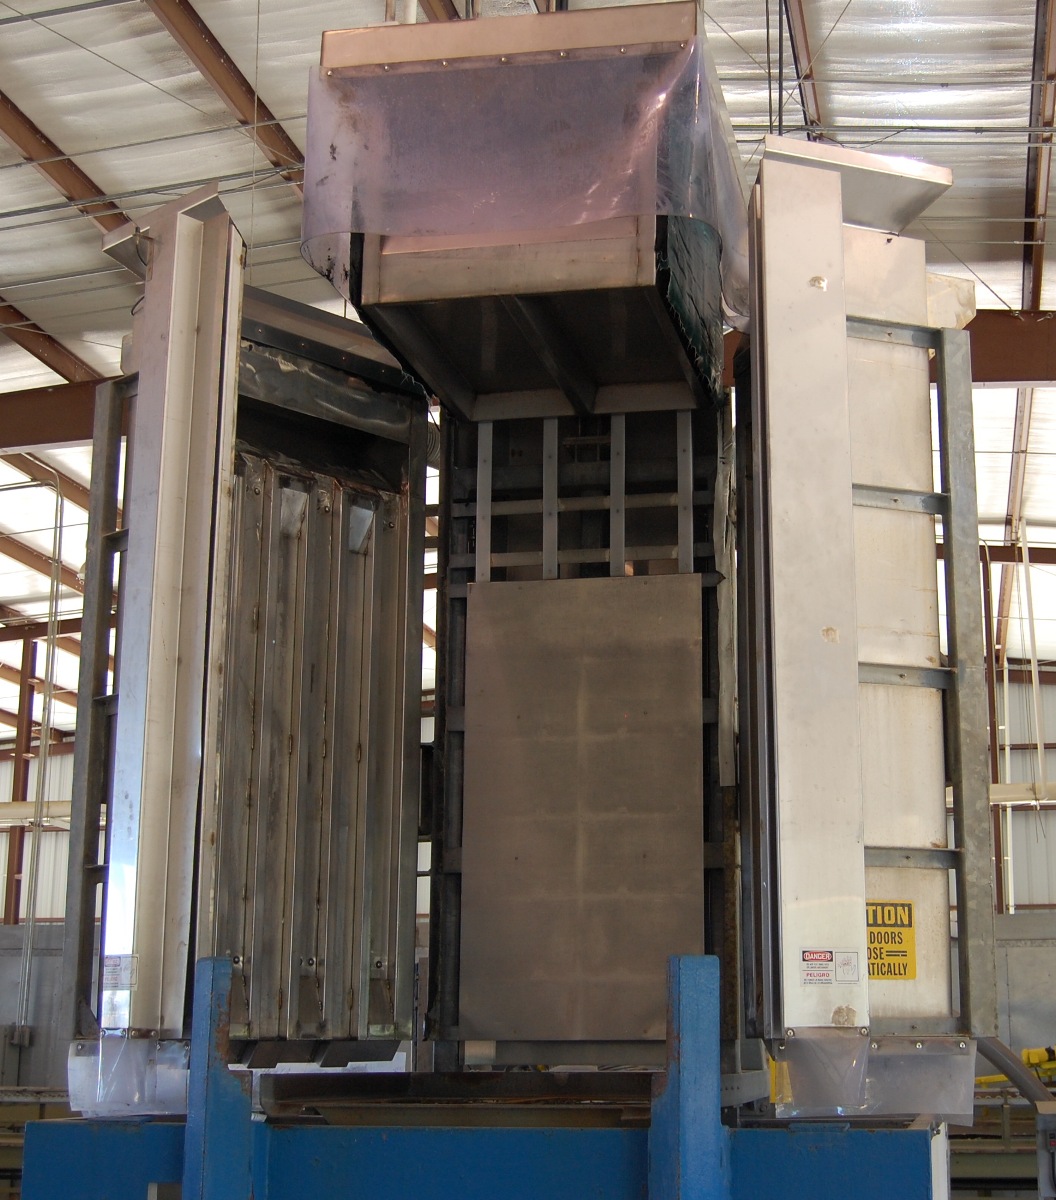 Figure 5. A “clamshell” type of package-icing cooler used
for broccoli in Georgia (Courtesy of Lewis Taylor Farm).
It should be noted that there are several limitations to
package-icing. First, the product must be tolerant of
the wet condition at 32°F for a prolonged time. Second,
the container should also be able to withstand
wet conditions. Third, since the typical weight of the
ice for initial cooling is equivalent to 30 percent of
the product weight, this can increase the freight load
significantly. Finally, the water from the melted ice
could be a potential source of contamination (chlorine
is usually added to the ice to address this issue).
Vacuum cooling
Vacuum cooling cools fresh produce based on the
principle of evaporation cooling: The moisture evaporates
and takes heat away from the fresh produce when
the atmospheric pressure is reduced below the boiling
temperature of water. Leafy vegetables with a large
surface area to mass ratio (such as iceberg lettuce) are
well suited for this cooling method and can be cooled
on a large scale by putting them in air-tight chambers
and pumping out air and water vapor using steam-jet
pumps. This method can cool packed produce quickly
and uniformly in large loads (usually in 20 minutes to
two hours), but container walls or other barriers that
slow down evaporation can seriously inhibit cooling.
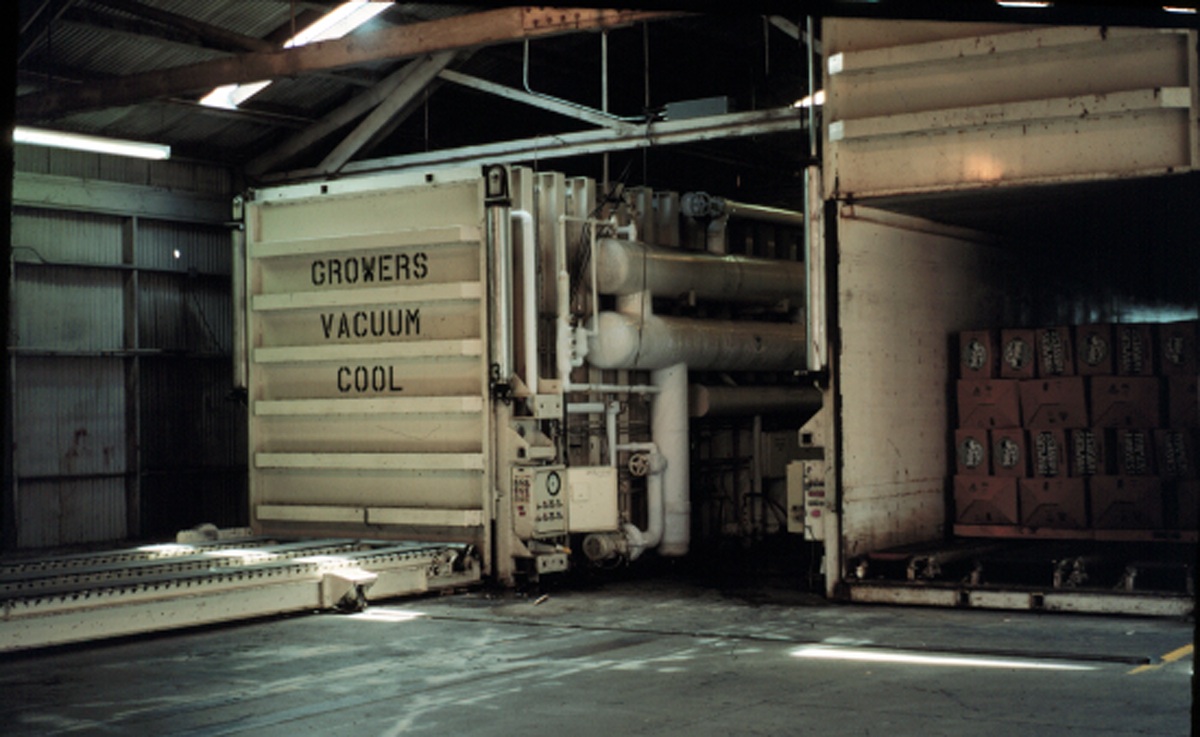 Figure 6. Vacuum cooler (Courtesy of Paul Sumner)
Like any other cooling method, vacuum cooling also
has its limitations. One major disadvantage is that it
can create weight loss from the product due to evaporated
water. It is estimated that weight loss can be
as high as 1 percent of the product weight for every
11°F, which is observable for some fresh produce. One
method to overcome this drawback is to add water to
the surface of the product using a spray system during
the vacuum cooling process. However, it should be
noted that the water used must be disinfected to avoid
any food safety concerns.
Vacuum-cooling equipment is expensive and requires
skilled operators. To be economically feasible, there
must be a large daily and annual output of cooled produce.
It is best if the vacuum cooler is either located
close to a long-season production area or is portable
so it can be moved to locations where there is such
production.
Cooling Method Selection Criteria
The five cooling methods described in this publication
have their advantages and disadvantages. Some of
the methods may not be suitable for certain fruits and
vegetables due to physiological constraints. For instance, some fruits and vegetables (such as berries and
mushrooms) are prone to diseases under wet conditions.
Table 3 lists recommended cooling methods for
typical fresh products. In addition to the compatibility
issue, product temperature requirements, cooling system
costs and refrigeration capacity are several major
factors that growers need to consider when planning to
build a precooling facility.
The product temperature requirement is the most
important issue to consider when building a precooling
facility. Temperature requirements for various
fruits and vegetables are shown in Table 2. If a grower
handles multiple products with different optimal storage
temperatures, it is usually difficult to use just one
cooler. For instance, one large vegetable shipper in
Georgia has four different precooling systems in his
packing shed. It is particularly important that chillsensitive
commodities not be stored below the critical
threshold temperatures or damage may result.
Cost of the cooling system, including capital, energy,
labor and other equipment, is another important factor
to consider. Liquid ice coolers are the most expensive,
followed by vacuum coolers, forced-air coolers, hydrocoolers
and room coolers. However, other considerations
should be factored in as well. For instance, a
vacuum cooler is portable and can be moved to different
production areas, which increases the frequency of
its usage and consequently reduces its capital costs per
unit cooled. Energy costs can also differ significantly.
The vacuum cooler is the most energy-intensive cooling
method, followed by the hydrocooler, water spray
vacuum cooler, package-icing cooler and forced-air
cooler. Labor and other equipment costs should also
be considered when comparing different cooling systems,
especially if special packaging (e.g., waxed box
or RPC box) is required.
Refrigeration capacity estimation is important for selecting
the right cooler. Several factors need to be considered,
such as the heat load (the amount of product
to be cooled), the initial temperature of the product,
the rate of cooling, the insulation condition of the cold
room and other heat sources generated from electrical
components in the cooling facility (motors, lights,
people, etc.). A detailed example of how to calculate
refrigeration load is provided in the following section.
Refrigeration Load Calculation
Table 2 lists optimal temperatures for fruits and vegetables.
In most commercial practices, however, products
are rarely cooled to the optimal temperature due
to the relatively high costs and longer precooling time.
Instead, for most commercial practices, products are
cooled to seven-eighths cooling temperature or halfcooling
temperature and then moved from the cooler
to a cold room for further cooling.
The seven-eighths cooling temperature is the temperature
that is seven-eighths of the temperature difference
between the product and the coolant. The seveneighths
cooling time is the time required to cool the
product to the seven-eighths cooling temperature. Similarly,
the half-cooling time is the time required to cool
the product to reach the half-cooling temperature. For
example, if cabbage is harvested at 90° F and cooled
in a forced-air cooler with a cooling air temperature of
30° F, the seven-eighths cooling temperature is 37.5° F
and the half-cooling temperature is 60° F.
As a rule of thumb, the seven-eighths cooling time is
usually three times the half-cooling time. The seveneighths
cooling time is generally used in commercial
precooling practices because it is constant for a given
product cooled by a specific cooling method no matter
what temperatures the product and coolant are.
Example
To properly design a cooling system and select the
appropriate cooling equipment, it is important to know
the refrigeration load of the product to be cooled. Below
is an example of how to calculate the refrigeration
load for Chinese cabbage using the forced-air cooling
method (the most widely used precooling method).
In this example, we assume that there are two batches
of Chinese cabbage loaded in the cooling facility during
the afternoon (between 1:00 p.m. and 5:00 p.m.).
The first batch of cabbage is loaded at 1:00 p.m. with
an initial temperature of 86° F. The second batch of
cabbage is loaded at 3:00 p.m. with an initial temperature
of 90° F. Both batches weigh 8,000 pounds. We
assume that the seven-eighths cooling time for Chinese
cabbage is three hours. The cooling air temperature
is 31° F. The specific heat of the Chinese cabbage
is 0.96 Btu/lb/°F. The refrigeration capacity of the
coolant is 12,000 Btuh/ton.
Calculating refrigeration load of the forced-air cooling system
The refrigeration load of the forced-air cooling system can be calculated by the following equation:
RT=
Where:
- RT = the refrigeration capacity (tons).
- ΔT = the temperature drop (°F)/hour during the cooling
period. In this case, since the seven-eighths cooling
time for Chinese cabbage is three hours and the
half-cooling time equals one third of the seven-eighths
cooling time, the temperature drop ΔT within one hour
is the half-cooling temperature (i.e., the initial temperature
difference between the cold air (31° F) and
the product (86° F) is (86-31)/2 = 27.5° F). - m = the weight of the product (in pounds). In this
case, m = 8,000 pounds. - cp = the heat capacity of the product (Btu/lb/°F). For
Chinese cabbage, cp is 0.96 Btu/lb/°F (data for other
products can be found in Table 2). - k = the refrigeration capacity (Btuh/ton) of the coolant.
In this case, k=12,000 Btuh/ton. - As calculated in Table 4, the peak refrigeration load is
23.3 tons at 3:00 p.m.
Calculating total refrigeration load
In practice, the total refrigeration load is calculated by
the following equation:
RTP=RTT × (1 + Q1 + Q2)
Where:
- RTP = the practical refrigeration load (tons).
- RTT = the theoretical peak refrigeration load (tons).
- Q1 = the coefficient to include other heat loads in the
cooling facility, such as the motor, lights, people and
heat infiltration from outside. It is usually set at 0.25. - Q2 = the safety coefficient to account for other unexpected
heat loads such as cooling unusually warm
products. It is usually set at 0.15. - In this example, the final practical refrigeration load
(RTP) is 32.6 tons.
Summary
Precooling is one of the most important procedures
used to maintain the quality of fruits and vegetables
after harvest and before storage or shipping. There
are five major precooling methods practiced in Georgia:
room cooling, forced-air cooling, hydrocooling,
package-icing and vacuum cooling. Each method has
its advantages and disadvantages. Selecting the right
precooling method for the product depends on several
factors, such as the suitability of the cooling method
to the specific product, temperature requirement of the
product, cooling rate, cost and refrigeration load.
The optimal temperatures of the fruits and vegetables
listed in Table 2 provide guidelines for growers, but
are rarely achieved during the precooling process
in most commercial practices due to the high costs
and longer cooling time required. In practice, seveneighths
cooling temperature or half-cooling temperature
is used. Care should be taken when cooling chillsensitive
products to avoid chilling injury.
References
Boyette, M.D., et al. AG-413-8, Postharvest Cooling
and Handling of Green Beans and Field Peas. North
Carolina State University.
Boyette, M.D. et al. AG-414-3, Forced-air Cooling.
North Carolina State University.
Boyette, M.D. et al. AG-414-4, Hydrocooling. North
Carolina State University.
USDA ARS. The Commercial Storage of Fruits, Vegetables,
and Florist and Nursery Stocks. Handbook 66,
2004.
J. F. Thompson, F. G. Mitchell, and R. F. Kasmire.
2002. Cooling Horticultural Commodities. In Postharvest
Technology of Horticulture Crops. Edited by
Kader, A. A. 2002. Davis, Postharvest Technology
Research & Information Center, University of California
Davis. Publication 3311.
M. T. Talbot, S. A. Sargent, and J. K. Brecht. 2002.
Cooling Florida Sweet Corn. University of Florida Institute
of Food and Agricultural Sciences Cooperative
Extension Service.
J. F. Thompson, F. G. Mitchell, T. R. Rumsey, R.F.
Kasmire, C. H. Crisosto. 2008. Commercial Cooling
of Fruits, vegetables, and flowers. Revised Edition.
University of California Agriculture and Natural Resources.
Publication 21567.
Paul E. Sumner. 1987. Commercial Cooling of Georgia
Fruits and Vegetables. University of Georgia
College of Agricultural and Environmental Sciences.
Cooperative Extension Bulletin 972.
Table 1: Summary of respiration rates for fresh fruits and vegetables when stored at various temperatures.
| Commodity |
32°F
|
41°F
|
50°F
|
59°F
|
68°F
|
77°F
|
|
Btu per ton per day at indicated temperature
|
||||||
| Apples, fall |
660
|
1320
|
1980
|
3300
|
4400
|
nd1
|
| Apricot |
1320
|
nd
|
3520
|
nd
|
8800
|
nd
|
| Beans, snap |
4400
|
7480
|
12760
|
20240
|
28600
|
nd
|
| Blackberry |
4180
|
7920
|
13640
|
16500
|
25300
|
nd
|
| Blueberry |
1320
|
2420
|
6380
|
10560
|
15400
|
22220
|
| Broccoli |
4620
|
7480
|
17820
|
37400
|
66000
|
nd
|
| Cabbage |
1100
|
2420
|
3960
|
6160
|
9240
|
13640
|
| Carrot (topped) |
3300
|
4400
|
6820
|
8800
|
5500
|
nd
|
| Cauliflower |
3740
|
4620
|
7480
|
10120
|
17380
|
20240
|
| Cucumber |
nd
|
nd
|
5720
|
6380
|
6820
|
8140
|
| Eggplant | ||||||
|
American
|
nd
|
nd
|
nd
|
151802
|
nd
|
nd
|
|
Japanese
|
nd
|
nd
|
nd
|
288202
|
nd
|
nd
|
|
White egg
|
nd
|
nd
|
nd
|
248602
|
nd
|
nd
|
| Fig |
1320
|
2860
|
4620
|
nd
|
11000
|
nd
|
| Grape, American |
660
|
1100
|
1760
|
3520
|
7260
|
8580
|
| Grape, muscadine |
22003
|
2860
|
nd
|
nd
|
11220
|
nd
|
| Grape, table |
660
|
1540
|
2860
|
nd
|
5940
|
nd
|
| Honeydew melon |
nd
|
1760
|
3080
|
5280
|
6600
|
7260
|
| Leek |
3300
|
5500
|
13200
|
21120
|
24200
|
25300
|
| Lettuce | ||||||
|
Head
|
2640
|
3740
|
6820
|
8580
|
12320
|
18040
|
|
Leaf
|
5060
|
6600
|
8580
|
13860
|
22220
|
32340
|
| Nectarine (ripe) |
1100
|
nd
|
4400
|
nd
|
19140
|
nd
|
| Cantaloupe |
1320
|
2200
|
3300
|
8140
|
12100
|
14740
|
| Okra |
46203
|
8800
|
20020
|
32120
|
57420
|
75900
|
| Onion |
660
|
1100
|
1540
|
1540
|
1760
|
nd
|
| Pea | ||||||
|
Garden
|
8360
|
14080
|
18920
|
38500
|
59620
|
68860
|
|
Edible pod
|
8580
|
14080
|
19580
|
38720
|
60060
|
nd
|
| Peach (ripe) |
1100
|
nd
|
4400
|
nd
|
19140
|
nd
|
| Pepper |
nd
|
1540
|
2640
|
5940
|
7480
|
nd
|
| Persimmon |
1320
|
nd
|
nd
|
nd
|
4840
|
nd
|
| Plum (ripe) |
660
|
nd
|
2200
|
nd
|
4400
|
nd
|
| Prickly pear |
nd
|
nd
|
nd
|
nd
|
7040
|
nd
|
| Radish | ||||||
|
Topped
|
3520
|
4400
|
7480
|
16280
|
28600
|
37840
|
|
Bunched with tops
|
1320
|
2200
|
3520
|
7040
|
11220
|
16500
|
| Raspberry |
37403
|
5060
|
7700
|
9240
|
27500
|
nd
|
| Southern pea | ||||||
|
Whole pods
|
52803
|
5500
|
nd
|
nd
|
32560
|
nd
|
|
Shelled peas
|
63803
|
nd
|
nd
|
nd
|
27720
|
nd
|
| Spinach |
4620
|
9900
|
24200
|
39380
|
50600
|
nd
|
| Squash, summer |
5500
|
7040
|
14740
|
33660
|
36080
|
nd
|
| Squash, winter |
nd
|
nd
|
217802
|
nd
|
nd
|
nd
|
| Strawberry |
3520
|
nd
|
16500
|
nd
|
33000
|
nd
|
| Sweet corn |
9020
|
13860
|
23100
|
34980
|
57420
|
78980
|
| Tomato |
nd
|
nd
|
3300
|
4840
|
7700
|
9460
|
| Turnip root |
1760
|
2200
|
3520
|
5060
|
5500
|
nd
|
| Watermelon |
nd
|
880
|
1760
|
nd
|
4620
|
nd
|
| 1 nd = Not determined. 2 At 55° F. 3 At 36° F. NOTE: Reprinted from “The Commercial Storage of Fruits, Vegetables, and Florist and Nursery Stocks,” Agricultural Handbook 66, USDA, 2004. |
||||||
Table 2: Summary of optimal handling conditions for fresh fruits and vegetables.
| Common name |
Storage
temperature °F |
Relative
humidity % |
Highest freezing
temperature °F |
Specific heat1
Btu/lb/°F |
Approximate
storage life |
| Apple |
40 2
|
90-95
|
29.3
|
0.87
|
1-2 months
|
| Apricot |
31-32
|
90-95
|
30
|
0.88
|
1-3 weeks
|
| Beans | |||||
|
Lima
|
41-43
|
95
|
31
|
0.73
|
5-7 days
|
|
Snap, wax, green
|
40-45
|
95
|
30.7
|
0.91
|
7-10 days
|
| Berries | |||||
|
Blackberry
|
31-32
|
90-95
|
30.6
|
0.88
|
3-6 days
|
|
Blueberry
|
31-32
|
90-95
|
29.7
|
0.86
|
10-18 days
|
|
Elderberry
|
31-32
|
90-95
|
30.0
|
0.84
|
5-14 days
|
|
Strawberry
|
32
|
90-95
|
30.6
|
0.92
|
7-10 days
|
| Broccoli |
32
|
95-100
|
31.0
|
0.92
|
10-14 days
|
| Cabbage | |||||
|
Chinese, Napa
|
32
|
95-100
|
30.4
|
0.96
|
2-3 months
|
|
common, early crop
|
32
|
98-100
|
30.4
|
0.94
|
3-6 weeks
|
|
late crop
|
32
|
95-100
|
30.4
|
0.94
|
5-6 months
|
| Carrots | |||||
|
topped
|
32
|
98-100
|
29.5
|
0.91
|
6-8 months
|
|
bunched, immature
|
32
|
98-100
|
29.5
|
0.91
|
10-14 days
|
| Cauliflower |
32
|
95-98
|
30.6
|
0.93
|
3-4 weeks
|
| Collards |
32
|
95-100
|
31.1
|
0.90
|
10-14 days
|
| Corn, sweet |
32
|
95-98
|
31.0
|
0.79
|
5-8 days
|
| Cucumber |
50-54
|
85-90
|
31.1
|
0.97
|
10-14 days
|
| Egglplant |
50-54
|
90-95
|
30.6
|
0.94
|
1-2 weeks
|
| Fig, fresh |
31-32
|
85-90
|
27.6
|
0.82
|
7-10 days
|
| Kale |
32
|
95-100
|
31.1
|
0.89
|
10-14 days
|
| Leek |
32
|
95-100
|
30.7
|
0.88
|
2 months
|
| Lettuce |
32
|
98-100
|
31.7
|
0.96
|
2-3 weeks
|
| Melons | |||||
|
Cantaloupes and other netted melons
|
36-41
|
95
|
29.9
|
0.94
|
2-3 weeks
|
|
Honeydew
|
41-50
|
85-90
|
30.1
|
0.94
|
3-4 weeks
|
| Nectarine |
31-32
|
90-95
|
30.3
|
0.85
|
2-4 weeks
|
| Okra |
45-50
|
90-95
|
28.7
|
0.92
|
7-10 days
|
| Onions | |||||
|
Mature bulbs, dry
|
32
|
65-70
|
30.6
|
0.90
|
1-8 months
|
|
Green
|
32
|
95-100
|
30.4
|
0.91
|
3 weeks
|
| Parsley |
32
|
95-100
|
30
|
0.88
|
1-2 months
|
| Peach |
31-32
|
90-95
|
30.3
|
0.91
|
2-4 weeks
|
| Pear |
29-31
|
90-95
|
29.0
|
0.86
|
2-7 months
|
| Peas in pods; snow, snap & sugar peas |
32-34
|
90-98
|
30.9
|
0.79
|
1-2 weeks
|
| Peppers | |||||
|
Bell pepper
|
45-50
|
95-98
|
30.7
|
0.94
|
2-3 weeks
|
|
Hot peppers, chilies
|
41-50
|
85-95
|
30.7
|
nd3
|
2-3 weeks
|
| Persimmon, Japanese |
32
|
90-95
|
28.0
|
0.83
|
2-3 months
|
| Plums and prunes |
31-32
|
90-95
|
30.5
|
0.89
|
2-5 weeks
|
| Pumpkin |
54-59
|
50-70
|
30.5
|
0.92
|
2-3 months
|
| Radish |
32
|
95-100
|
30.7
|
0.96
|
1-2 months
|
| Rutabaga |
32
|
98-100
|
30.1
|
0.91
|
4-6 months
|
| Spinach |
32
|
95-100
|
31.5
|
0.94
|
10-14 days
|
| Squash | |||||
|
Summer (soft rind), courgette
|
45-50
|
95
|
31.1
|
0.95
|
1-2 weeks
|
|
Winter (hard rind), calabash
|
54-59
|
50-70
|
30.5
|
0.88
|
2-3 months
|
| Sweet potato, yam |
55-59
|
85-95
|
29.7
|
0.75
|
4-7 months
|
| Tomato | |||||
|
Mature-green
|
50-55
|
90-95
|
31.1
|
0.94
|
2-5 weeks
|
|
Firm-ripe
|
46-50
|
85-90
|
31.1
|
0.95
|
1-3 weeks
|
| Turnip root |
32
|
95
|
30.1
|
0.93
|
4-5 months
|
| Watermelon |
50-59
|
90
|
31.3
|
0.94
|
2-3 weeks
|
| 1 The specific heat data were taken from “The Commercial Storage of Fruits, Vegetables, and Florist and Nursery Stocks,”
Agricultural Handbook 66, USDA, 1968. 2 Some data are presented for low temperatures, which cause chilling injury for certain commodities; these temperatures are potentially injurious and should be avoided. 3 nd = Not Determined. NOTE: Reprinted with permission from J. F. Thompson, F. G. Mitchell, and R. F. Kasmire. 2002. Cooling Horticultural Commodities. In Postharvest Technology of Horticulture Crops. Edited by Kader, A. A. 2002. Davis, Postharvest Technology Research & Information Center, University of California Davis. Publication 3311. |
|||||
Table 3: Recommended cooling methods for selected fresh fruits and vegetables
|
Commodity
|
Size of operation
|
Remarks
|
|
|
Large
|
Small1
|
||
| Tree fruits | |||
|
Stone fruits (peaches, nectarines)
|
FA, HC
|
FA
|
|
|
Pome fruits (apples, pears)
|
FA, R, HC
|
R
|
|
|
Tropical
|
FA, R
|
FA
|
|
| Berries |
FA
|
FA
|
|
| Grapes |
FA
|
FA
|
Require rapid cooling adaptable to SO2 fumigation |
| Leafy vegetables | |||
|
Cabbage
|
VC, FA
|
FA
|
|
|
Iceberg lettuce
|
VC
|
FA
|
|
|
Kale, collards
|
VC, R, WVC
|
FA
|
|
|
Leaf lettuces, spinach, Chinese cabbage
|
VC, FA, WVC, HC
|
FA
|
|
| Root vegetables | |||
|
With tops
|
HC, PI, FA
|
HC, FA
|
Carrots can be VC |
|
Topped
|
HC, PI
|
HC, PI, FA
|
|
|
Sweet potatoes
|
HC
|
R
|
|
| Stem and flower vegetables | |||
|
Broccoli
|
HC, FA, PI
|
FA, PI
|
|
|
Cauliflower
|
FA, VC
|
FA
|
|
|
Green onions, leeks
|
PI, HC, WVC
|
PI
|
|
| Pod vegetables | |||
|
Beans
|
HC, FA
|
FA
|
|
|
Peas
|
FA, PI, VC
|
FA, PI
|
|
| Bulb vegetables | |||
|
Dry onions
|
R
|
R, FA
|
Should be adapted to curing |
| Fruit-type vegetables | |||
|
Cucumbers, eggplant
|
R, FA, FA-EC
|
FA, FA-EC
|
Fruit-type vegetables are chill-sensitive at varying temperatures |
| Melons | |||
|
cantaloupes
|
HC, FA, PI
|
FA, FA-EC
|
|
|
honeydew
|
FA, R
|
FA, FA-EC
|
|
|
watermelons
|
FA, HC
|
FA, R
|
|
| Peppers |
R, FA, FA-EC, VC
|
FA, FA-EC
|
|
| Summer squashes, okra |
R, FA, FA-EC
|
FA, FA-EC
|
|
| Sweet corn |
HC, VC, PI
|
HC, FA, PI
|
|
| Tomatoes |
R, FA, FA-EC
|
||
| Winter squashes |
R
|
R
|
|
| 1 small scale operation refers to coolers handling up to 1,000 lb/hr. | |||
|
Key: |
|||
| NOTE: Reprinted with permission from J. F. Thompson, F. G. Mitchell, and R. F. Kasmire. 2002. Cooling Horticultural Commodities. In Postharvest Technology of Horticulture Crops. Edited by Kader, A. A. 2002. Davis, Postharvest Technology Research & Information Center, University of California Davis. Publication 3311. | |||
Table 4. Peak refrigeration load calculation example for Chinese cabbage in a forced-air cooling system.
| Time |
Product
load (lbs.) |
Product temperature
(°F) |
Temperature drop ΔT
(°F/h) |
Refrigeration load for
each batch (tons) |
Total load
(tons) |
|||
|
1:00 p.m.
|
3:00 p.m.
|
1:00 p.m.
|
3:00 p.m.
|
1:00 p.m.
|
3:00 p.m.
|
|||
| 1:00 p.m. |
8,000
|
86
|
27.5
|
17.6
|
17.6
|
|||
| 2:00 p.m. |
58.5
|
13.8
|
8.8
|
8.8
|
||||
| 3:00 p.m. |
8,000
|
44.8
|
90
|
6.9
|
29.5
|
4.4
|
18.9
|
23.3
|
| 4:00 p.m. |
37.9
|
60.5
|
14.8
|
9.4
|
9.4
|
|||
| 5:00 p.m. |
45.8
|
7.4
|
4.7
|
4.7
|
||||
| 6:00 p.m. |
38.4
|
|||||||